COudé Near Infrared CAmera
CONICA (COudé Near Infrared CAmera) is an instrument for diffraction limited imaging, coronography, spectroscopy, and polarimetry at the VLT in the 1 to 5µm spectral range. It has been built under ESO contract by a consortium of MPIA (PI Rainer Lenzen) and MPE (CoI Reiner Hofmann). MPIA has been responsible for the optics and cryo-mechanics, MPE contributed the detector and the readout electronics. The instrument is available to the astronomical community since fall 2002. 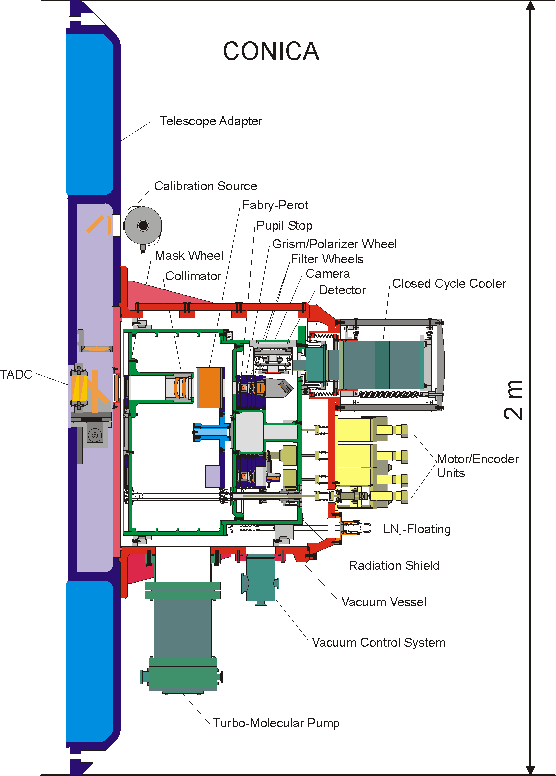
In 1991, CONICA was designed as a speckle camera with the largest then available arrays, a 256×256 HgCdTe NICMOS 3 array from Rockwell for the wavelength range 1 - 2.5µm, and a 256×256 InSb array from SBRC for 2.5 - 5µm. In summer 1995, when larger arrays were announced, the consortium changed the design to replace the two smaller arrays by a 1024×1024 InSb ALADDIN 2 array from SBRC to cover the 1 - 5µm range. This array had 32 video output channels and was read at a frame rate of 20 Hz which is sufficient for speckle observations in the near infrared. In 2004 the ALADDIN 2 array was replaced by an ALADDIN 3 array of the same size.
The layout of CONICA is shown on the right.
End of 1996, ESO decided to implement an adaptive optics system, called NAOS (Nasmyth Adaptive Optics System), between the telescope and CONICA. At the same time, CONICA was moved from the Coudé focus to one of the Nasmyth foci. NAOS was originally equipped with wavefront sensors for the visible spectral range only. During the design phase, an infrared wavefront sensor was added, which made the speckle mode of CONICA obsolete. NAOS has been built by a French consortium and has been extensively tested together with CONICA in Paris. The combination of NAOS and CONICA is the most complex first generation instrument to be installed at the VLT.
CONICA is operated at about 80K, the detector array is cooled down to 35K, all optical components (except for the dispersion compensator) are located inside the cryostat. CONICA has a fixed collimator, 4 cameras for the short wavelength range (1 - 2.5µm) with image scales of 13.6, 27.3, 54.6, and 109.2 mas/pixel, and 3 cameras for the long wavelength range (2.5 - 5µm) with image scales of 27.3, 54.6, and 109.2 mas/pixel. The field of view varies between 14 arcsec for the largest magnification and 73 arcsec diameter (vignetted) for the smallest magnification.
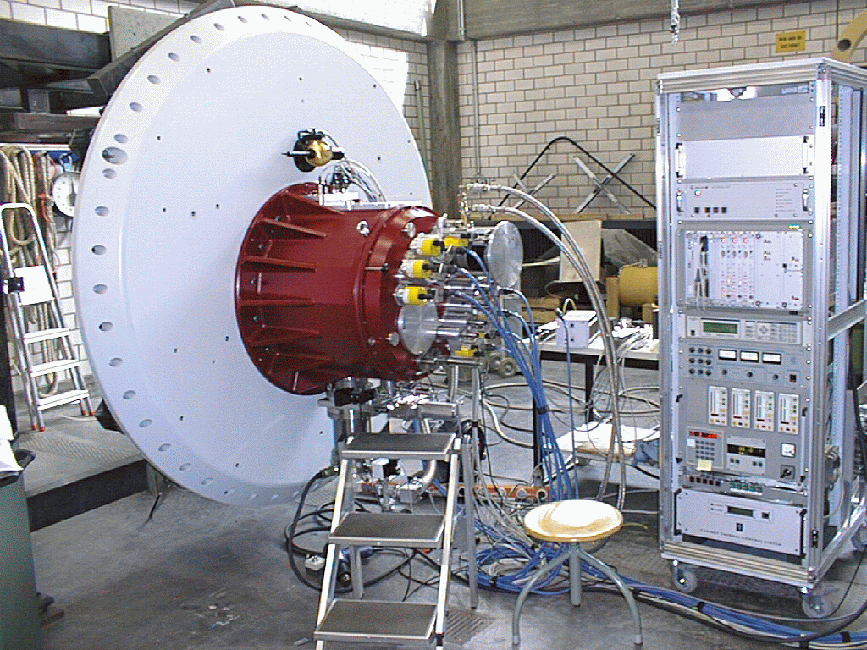
The picture below shows the CONICA cryostat (red) mounted to the telescope adapter at MPIA.
41 optical filters are mounted in 2 filter wheels. Among them 7 wide band filters for the atmospheric windows form J to M, 3 for filters ice features between 3.0 and 3.6µm (R = 10), 10 for selected spectral lines (R ~ 50 - 100), and 20 order selector filters (R ~ 30) for the cold K-band Fabry-Perot etalon (R ~ 1800). Four grisms are available for low resolution spectroscopy (R ~ 200 - 1000) in all bands, the entrance slit widths are 42, 85, and 170 mas on the sky. Polarimetry can be done using 4 wire grid polarizers with the relative direction of polarization of 0, 45, 90, and 135 degrees. Additionally, two Wollaston prisms rotated 45 degrees relative to each other are available (the two beams of different polarization are separated by about 3 arcsec on the sky). In the telescope focal plane, field masks, the slit masks for grisms, and a coronographic mask are mounted in the mask wheel. In the pupil plane, a series of Lyot stops is available to block radiation from the central hole in the primary and from the spiders supporting the secondary. A tunable dispersion compensator can be inserted into the beam to correct for differential atmospheric dispersion at large zenith distances in J- and H-Band, where the differential dispersion is of the order of the diffraction limit for an 8m telescope.
 The picture to the right shows CONICA (red) and NAOS (light blue) mounted to the Nasmyth adapter (dark blue) of the VLT unit telescope number 4 during the commissioning phase 1 in November 2001.
The last figure (below) shows on the left hand side a short exposure image of a star as seen by standard instruments, the right hand side shows a long exposure image of the same star with the effects of the atmospheric turbulence corrected by the adaptive optics system. The center figure represents the same data as three dimensional intensity plot. Note the concentration of the light flux in a small area and the strongly enhanced peak intensity. This enhancement of the peak flux results in a correspondingly increased point source sensitivity.

Picture credits: 1, 2 : MPE; 3, 4 : ESO;