|
Numerische Simulation von Strukturen in Kometenplasmaschweifen |
Numerical Simulation of Structures in Cometary Plasma Tails |
|
In Plasmaschweifen von Kometen lassen sich viele verschiedene Strukturen, wie z. B. Strahlen, Knicke, wellenartige Phänomene, Knoten und sogenannte Schweif-abrisse beobachten. Ob die verschiedenen Strukturen zustande kommen, hängt hauptsächlich von der Aktivität des Kometen, den Sonnenwindbedingungen und dem interplanetaren Magnetfeld ab. Die Geschwindigkeitsverteilung von Dichteanhäufungen im Schweif als Funktion des Abstandes vom Kometenkern ist durch zahlreiche Beobachtungen für verschiedene Kometen bestimmt worden. Solche Strukturen starten in einer Entfernung von mehreren 104 km mit Geschwindigkeiten von etwa 10 km/s (relativ zum Kometenkern); sie werden mit etwa 100 cm/s2 beschleunigt und erhalten Geschwindigkeiten bis zu 100 km/s oder mehr, erreichen aber niemals die Geschwindigkeit des ungestörten Sonnenwindes. In den meisten Fällen sind die gemessenen Endgeschwindigkeiten größer, wenn die betrachtete Struktur weniger Masse enthält. |
Cometary plasma tails display a large variety of different structures, such as streamers, kinks, helical waves, knots and disconnection events. The appearance of these features depends strongly on the activity of the comet and the interplanetary solar wind and magnetic field. A wealth of ground-based observational data concerning the dynamics of density enhancements in the tail exists. Such structures start at distances of several 104 km with velocities of about 10 km/s (relative to the cometary nucleus); they get accelerated at rates of about 100 cm/s2 to final velocities of 100 km/s and more but never reach the velocity of the embedding free-flowing solar wind. In most cases the final structure velocities are anticorrelated to the total mass content of the particular structure. |
|
|
Abb. 3.1: Quasi-3D Darstellung des Simulationsraumes. Es sind Isoflächen für die Protonen (links) und die schweren Ionen (rechts) eingefügt. Die Richtung des Magnetfeldes ist durch die Vektorlinien gekennzeichnet. Die Magnetfeldstärke ist auf einer Farbskala dargestellt (rot steht für > 40 nT, blau für 0 nT).
Fig. 3.1: Quasi-3D representation of the simulation space. Isosurfaces for the proton (left) and heavy-ion (right) density are included. The direction of the magnetic field is indicated by the vector lines. The magnetic field strength is shown on a linear colour scale (red means > 40 nT, blue means 0 nT). |
|
Viele Strukturen können durch Änderung der äußeren Bedingungen, z. B. durch Umpolung des interplanetaren Magnetfeldes, erklärt werden. Andere Strukturen, wie z. B. Strahlen, wellenartige Phänomene und Knoten im Schweif, treten oft über lange Zeiträume auf und können daher nicht durch einmalige Änderungen der äußeren Bedingungen begründet werden. Auch im Plasmaschweif des Kometen Austin wurden im Mai 1990 vom Skinakas/Kreta zeitlich regelmäßige Strukturen beobachtet (siehe MPE-Tätigkeitsbericht 1990). Die Beobachtungen zeigen periodische Knotenstrukturen im Plasmaschweif. Einzelne dieser Strukturen wurden zeitlich verfolgt und deren Geschwindigkeiten als Funktion des Abstands vom Kometenkern ermittelt. Faßt man alle beobachteten Strukturen zusammen, erhält man eine durchschnittliche Beschleunigung von etwa 120 cm/s2 entlang des Schweifs. |
Many tail phenomena can be explained by changes in the external conditions, for example an abrupt change in the direction of the interplanetary magnetic field. Other structures like streamers, helical waves and knots in the tail occur regularly and over long time periods and thus should not be explained by singular external causes. Regular structures have also been observed at comet Austin in May 1990 from Skinakas/Crete (see MPE Report 1990). The observations show periodical knot structures in the tail. Some of these knots have been traced and their velocity as function of the distance from the nucleus was determined. If one fits the velocity versus separation of most of the structures by assuming constant acceleration, a mean acceleration rate of about 120 cm/s2 along the tail is found. |
|
Um die Wechselwirkung des Kometenplasmas mit dem Sonnenwind, insbesondere die Entstehung von Strukturen im Plasmaschweif, besser zu verstehen, führen wir numerische Simulationen durch. Wir verwenden dabei ein zwei-Ionen-MHD-Modell unter der Annahme von kalten Ionen und Vernachlässigung von Hall-Effekten. In der 3D-Simulation werden kometare schwere Ionen kugelsymmetrisch zum Ort eines gedachten Kometenkerns produziert, die mit dem zunächst ungestörten Sonnenwind, bestehend aus Protonen, wechselwirken. Nach einer Weile stellt sich ein Gleichgewicht zwischen den einströmenden Protonen und den schweren Ionen des Kometen ein. |
In order to better understand the interaction between the solar wind and the cometary plasma environment, especially the structuring phenomena in a cometary plasma tail, we perform numerical simulations. We use a bi-ion fluid MHD model, assuming cold ions and neglecting Hall-effects. In the 3D simulation, cometary heavy ions are produced by a spherically symmetric source and interact with the solar wind, consisting of protons. After a transition period, a state of dynamical equilibrium between the heavy ions and the inflowing protons is reached. |
|
Die wichtigsten Merkmale eines Kometenplasmas werden in der Simulation wiedergegeben. Das Magnetfeld verdichtet sich stromaufwärts, eine Bugstoßwelle entsteht. Abb. 3.1 zeigt eine quasi-3D Darstellung einer Simulationsrechnung, bei der das Magnetfeld in der xy-Ebene liegt und mit einem Winkel von 45° zur Sonnenwindrichtung (x-Richtung) einläuft, die Quellstärke des simulierten Kometen beträgt 1028 s-1, die Machzahl des Sonnenwindes ist 4. Es sind zwei Isoflächen, eine der Protonendichte (links), eine der Dichte der schweren Ionen (rechts), dargestellt. Die Fläche der Protonen zeigt näherungsweise die Lage und Geometrie der Bugstoßwelle, die der schweren Ionen stellt die Lage und Form des Kometenschweifes dar. In die Abbildung ist auch die Richtung des Magnetfeldes und dessen Stärke (Farbskala) in einer Ebene eingefügt. |
All prominent features of the cometary plasma environment can be observed in the simulation results. The magnetic field is piling up just upstream of the nucleus and a bow shock is formed. Fig. 3.1 is a quasi-3D illustration of the simulation results. In this example, the solar wind flows along the x-axis of a 3D simulation box and the magnetic field lies in the xz-plane at an angle of 45° with respect to the flow direction of the solar wind (the x-direction). The gas production rate of the simulated comet is 1028 s-1, the Machnumber of the undisturbed solar wind is 4. Two isosurfaces for the proton (left) and heavy ion (right) density are represented in the figure. The isosurface of the proton density is chosen so as to depict approximately the form of the bow shock. The other surface is representative for the dynamics of the heavy ions. The magnetic field direction and its strength (colour table) in one plane is also included in the figure. |
|
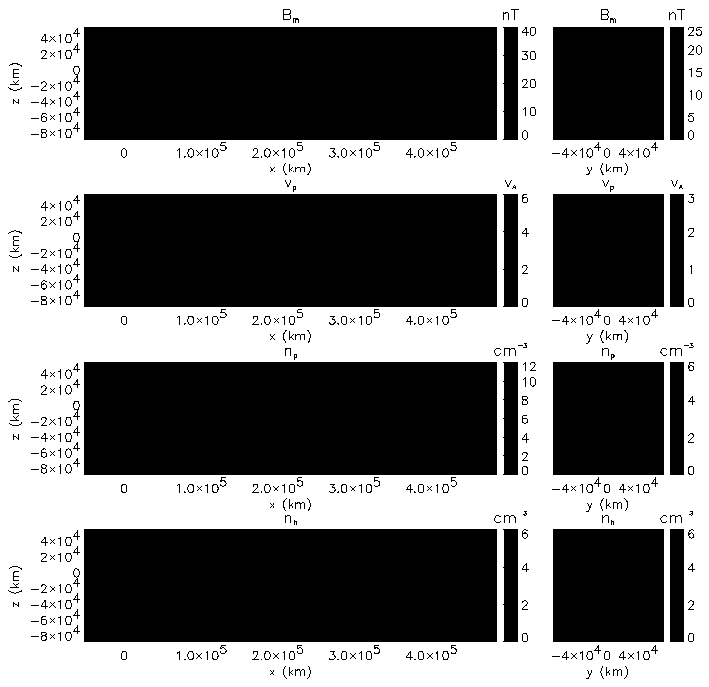
Abb. 3.2 zeigt das Magnetfeld, den Betrag der Protonengeschwindigkeit, die Protonendichte und die Dichte der schweren Ionen in zwei verschiedenen Schnitten durch den Simulationsraum. Die gezeigten projizierten Feldlinien demonstrieren das Herumwinden des Magnetfeldes um das Hindernis. Vor dem Kometenkern werden die Feldlinien gespannt, dahinter entspannen sie sich und beschleunigen das Plasma im Schweif. |
Fig. 3.2 shows xz- and yz-cuts through the simulation space. The magnitudes of the magnetic field and the proton velocity, the proton density and the heavy ion density have been chosen as representatives for the overall behaviour of the system. The magnetic field lines, mapped onto the cuts, demonstrate the draping of the magnetic field around the obstacle. Upstream of the nucleus, the fieldlines are stretched; the ones downstream tend to relax to their undisturbed state. |
|
|
|
|
Abb. 3.2: 2D-Schnitte des 3D-Simulationsraumes. Links: xz-Ebene durch den Kometenkern. Rechts: yz-Ebene bei x = 70000 km stromabwärts. Dargestellt sind Magnetfeldstärke, Betrag der Protonengeschwindigkeit (normiert auf die Alfvéngeschwindigkeit des ungestörten Sonnenwindes vA = 145 km/s), Protonendichte und Dichte der schweren Ionen. Der Sonnenwind fließt entlang der x-Richtung, das ungestörte Magnetfeld liegt in der xz-Ebene mit einer Neigung von 45° zur x-Achse. Die im unteren Bild gezeigten Feldlinien sind Projektionen von Feldlinien, die in der dargestellten Ebene durch den Kometenschweif gehen Fig. 3.2: 2D cuts of the simulation space. Left: xz-plane through the cometary nucleus. Right: yz-plane at x = 70000 km downstream. The magnetic field strength, the magnitude of the proton velocity (normalized to the Alfvén velocity of the undisturbed solar wind vA = 145 km/s), the proton density and the heavy ion density are shown. The solar wind flows along the x-axis, the undisturbed magnetic field lies in the xz-plane at an angle of 45° to the x-axis. The field lines in the bottom plot are projections of field lines that pierce the cometary tail in the plane of the cut. |
|
|
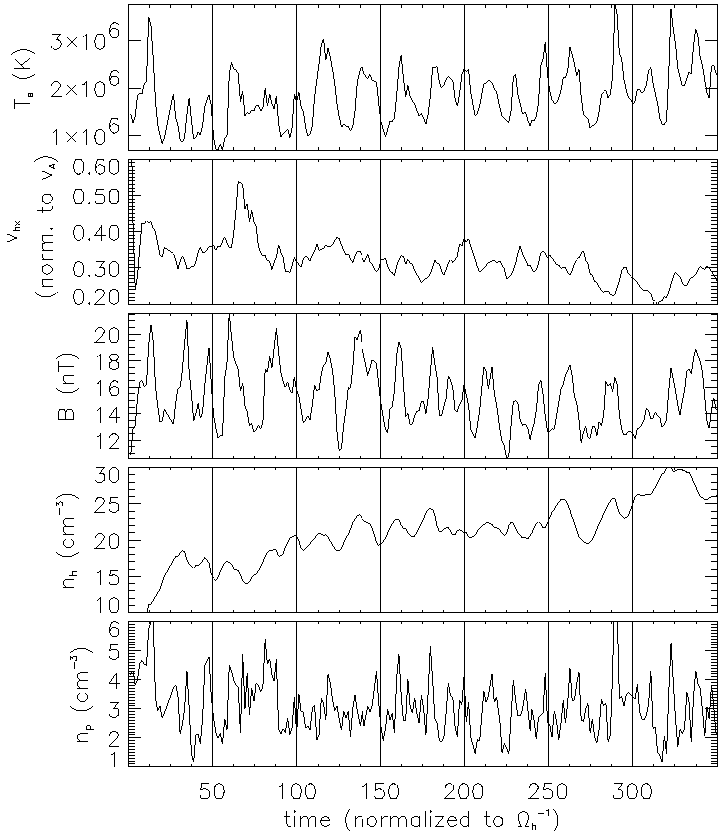
Abb. 3.3: Zeitliche Entwicklung einiger Simulationsvariablen in einer Entfernung von 5000 km stromabwärts. Die Zeit ist auf die inverse Gyrationsfrequenz der schweren Ionen normiert (W h-1 = 9 s).
Fig. 3.3: Temporal evolution of several simulation variables at a distance of 5000 km downstream of the nucleus. The time is normalized to the inverse gyrofrequency of the heavy ions (W h-1 = 9 s). |
|
Dieses Simulationsergebnis zeigt starke Strukturbildung im Schweif. In der Nähe des Kometenkerns werden Knoten gebildet, die sich dann in Richtung Schweif bewegen. Die zeitliche Entwicklung der Variablen in einem Punkt in 5000 km Entfernung stromabwärts vom Zentrum ist in Abb. 3.3 zu sehen. Alle Variablen zeigen periodisches Verhalten und sind untereinander stark korreliert. Die Periode beträgt 20 W h-1 » 180 s. Interessanterweise kommt es zu diesem periodischen Verhalten, obwohl stromaufwärts dynamisches Gleichgewicht herrscht und die externen Parameter dort konstant sind . |
This simulation result shows substantial structuring in the tail. Near the nucleus, knots are formed which propagate into the tail region. The temporal evolution of the simulation parameter values at a distance of 5000 km downstream from the nucleus is shown in Fig. 3.3. A periodic behaviour of all parameters with a strong mutual correlation is found. The period is 20 W h-1 » 180 s. The interesting point is: Although dynamic equilibrium is reached at the upstream side of the comet nucleus and the external parameters are constant there, the density on the downstream side remains subject to fluctuations. |
|
|
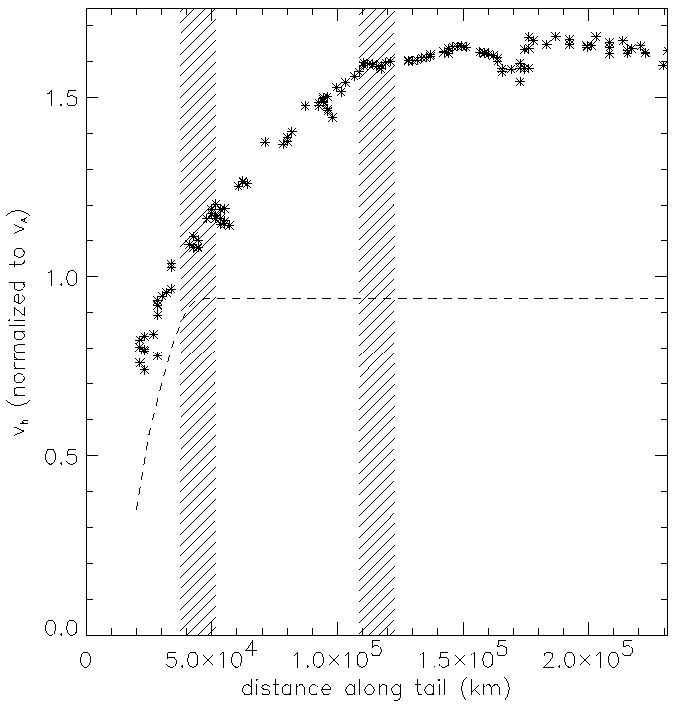
Abb. 3.4: Vergleich von Knoten- und Ionengeschwindigkeit anhand eines Knotens. Die gestrichelte Linie zeigt die Knotengeschwindigkeit, die Sternsymbole stehen für die Ionengeschwindigkeit im Knoten, normiert auf die Alfvéngeschwindigkeit des ungestörten Sonnenwindes (vA = 145 km/s). Die Schraffierungen veranschaulichen die Teilung in drei Regionen.
Fig. 3.4: Comparison of knot velocity and heavy ion velocity of one particular knot. The dashed line is the knot velocity, the asterisks represent the heavy ion velocity at the centre of the knot, normalized to the Alfvén velocity of the undisturbed solar wind (vA = 145 km/s). The hatched boundaries separate the three regions of different acceleration patterns. |
|
In Abb. 3.4 ist ein Vergleich der Geschwindigkeit der schweren Ionen im Schweif und der Knotengeschwindigkeit gezeigt. Man kann drei verschiedene Regionen unterscheiden: In der ersten Region werden die schweren Ionen und die Knoten beschleunigt, in der zweiten haben die Knoten bereits die Endgeschwindigkeit erreicht, die Ionen werden weiter beschleunigt, in der dritten Region schließlich erreichen auch die Ionen eine Endgeschwindigkeit und deren Fließgeschwindigkeit durch die Knoten bleibt etwa konstant (die Ionenendgeschwindigkeit beträgt in diesem Beispiel etwa doppelte Knotenendgeschwindigkeit). |
A comparison of the heavy ion velocity and the velocity of a particular knot (Fig. 3.4) reveals three different regions going from the nucleus out into the tail. In the first region, the heavy ions and knots are accelerated. Then the knots reach their final velocity while the ions still get accelerated. In the last region, the ions reach their final velocity and the flow speed through the knots remains constant. In this example, the final velocity of the heavy ions at the knot is a factor of 2 higher than the final velocity of the particular knot. |
|
In den Simulationen können ähnliche Strukturen wie im Schweif des Kometen Austin beobachtet werden. Da sich die Produktionsraten in beiden Fällen, Beobachtung und Simulation, um eine Größenordnung unterscheiden, ist kein direkter Vergleich von Zahlen möglich. Ohne die äußeren Bedingungen des Sonnenwindes zu ändern zeigen die Simulationen Schweifstrukturen über einen weiten Bereich von Parametersätzen (auch bei höheren Quellstärken), so daß die simulierten Effekte mit Sicherheit auch für Kometen, vergleichbar mit Austin, relevant sind. Die auftretenden nichtlinearen Effekte, die für die Bildung und Dynamik der Knoten verantwortlich sind, müssen jedoch noch genauer untersucht werden. |
The results from 3D bi-ion fluid simulations show structures in the tail similar to those observed at comet Austin. Since the gas production rates in the observation and simulation differ by one order of magnitude the two cases can not be compared directly. Nevertheless, our simulation results show tail structuring without changing the external solar wind plasma parameters in a wide range of parameter sets (also at higher gas production rates). So one can be confident that the effects seen in the simulations are also relevant for comets of the strength of comet Austin. The nonlinear effects that are responsible for the origin and dynamics of the knots in the tail still have to be studied in more detail. |
|
Ch. Th. Fischer, G. Haerendel, A. T. Bogdanov |


