
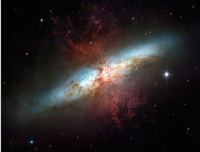
 Outflow from the galaxy Messier 82. Image Credit: NASA, ESA, and The Hubble Heritage Team (STScI/AURA).
Outflows are important processes in galaxy evolution because they regulate the sizes, masses and metal contents of galaxies. An outflow is launched when sufficient energy or momentum couples to the gas in the interstellar medium to allow the gas to be pushed out of the galaxy. The energy/momentum can come from either processes associated with massive stars (supernova explosions, radiation pressure) or accretion onto supermassive black holes (Active Galactic Nuclei or AGN). Most of the star formation and black hole accretion activity in the history of the universe occured approximately 8-11 billion years ago (z~1-3), and therefore outflows were also the strongest and most frequent during this epoch.
 Hα flux map for a galaxy at z~2.
In Davies et al. (2019a), we investigated how the frequency, velocity and mass loading factors of star formation driven outflows depend on the resolved star formation rate surface density (ΣSFR) within galaxies. We used adaptive-optics assisted near-infrared integral field data from the SINS/zC-SINF AO Survey to map the Hα line emission across 28 star forming galaxies at z~2-2.6, at a spatial resolution of 1-2 kpc. An Hα flux map for one of the galaxies is shown to the left. In regions with outflows, the Hα line has a composite profile, with a narrow component tracing the star formation and a broader component tracing the outflow. The width of the outflow component is a tracer of the outflow velocity, and the total flux in the outflow component is a tracer of the outflowing mass.
We found that the outflow velocity scales as vout ∝ ΣSFR0.34 (see figure below left). This power law scaling is steeper than expected for outflows driven by mechanical energy released by supernova explosions and stellar winds, but flatter than expected for outflows driven by radiation pressure acting on dust grains; suggesting that both of these mechanisms may play a significant role in driving the outflows. We also found that the mass loading factor η, defined as the ratio of the SFR to the mass outflow rate, is positively correlated with ΣSFR, but is relatively low (≤0.5) even at the highest ΣSFR (see figure below right). This may be in tension with cosmological simulations which typically require η ≳ 1 to reproduce properties of the local galaxy population, such as the stellar mass to halo mass relation and the mass-metallicity relation. However, we are only observing one phase of the outflows, and it is possible that a significant fraction of the outflowing material is in other gas phases (particularly neutral and molecular gas).
 Outflow Velocity as a Function of ΣSFR.
 Mass Loading Factor as a Function of ΣSFR.

My honours thesis was based on IFS data from the Siding Spring Southern Seyfert Spectroscopic Snapshot Survey (S7; Dopita+ 2015). S7 is a survey of ~140 local (z < 0.02) AGN host galaxies being conducted using the Wide Field Spectrograph (WiFeS) on the ANU 2.3m telescope. The survey aims to probe the detailed morphology, kinematics and physical conditions of the gas in AGN narrow line regions (NLRs). The panel below shows artificial 3 colour images of four of the S7 galaxies, where the red channel traces Hα emission, the green channel [N II] emission and the blue channel [O III] emission. We observe spectacular extended NLRs in many of the S7 galaxies, and some of the NLRs have very complex velocity structures. Our high spectral resolution (R = 7000) observations allow us to robustly separate emission associated with different kinematic components across the S7 datacubes and therefore to study each of the gas components separately. Approximately 80 of the S7 targets have been observed so far, and I have been actively involved in observing, data reduction and emission line fitting.
 False 3 colour images of the S7 galaxies. Red = Hα, green = [N II], blue = [O III]. H II regions appear red, orange or yellow whereas AGN ionized gas appears green, blue or purple. Images taken from Dopita+ 2015.
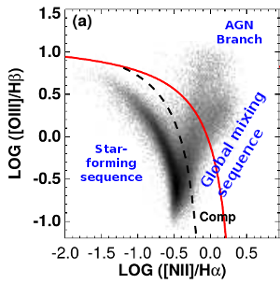 [N II]/Hα vs. [O III]/Hβ diagnostic diagram for galaxies from the Sloan Digital Sky Survey. Star-forming galaxies lie along the star-forming sequence, whereas galaxies with some contribution from an AGN lie along the AGN branch of the diagnostic diagram. Figure modified from Kewley+ 2006.
The [N II]/Hα vs. [O III]/Hβ diagnostic diagram is commonly used to classify the principal ionization mechanisms of galaxies. Sloan Digital Sky Survey (SDSS) galaxies lie along one of two distinct branches on the diagnostic diagram: the star-forming sequence (which traces variations in the metal abundance of the interstellar medium) and the AGN branch (which traces variations in the relative contributions of star formation and AGN activity to the emission line spectra). The presence of a hard AGN ionizing radiation field increases the average photon energy and therefore increases the nebular temperature, the collisional excitation rate and the [N II]/Hα and [O III]/Hβ ratios. The greater the contribution of the AGN to the observed emission line spectrum of a galaxy, the greater the enhancement in the line ratios and the further along the AGN branch the galaxy will lie. For this reason, the AGN branch of the diagnostic diagram is often referred to as a global starburst-AGN mixing sequence. However, the diagnostic line ratios are also sensitive to the metallicity and ionization parameter of the ionized gas and therefore the conversion between line ratios and absolute AGN fractions is intrinsically uncertain.
Integral field spectroscopy reduces this uncertainty significantly by making it possible to resolve the spectra of pure star formation and AGN activity (both spatially and spectrally) on a galaxy-by-galaxy basis. The spectra of individual spaxels in AGN host galaxies fall along mixing sequences between [N II]/Hα and [O III]/Hβ ratios characteristic of star formation and line ratios characteristic of AGN activity (as seen in the diagram to the below; Davies+ 2014a, 2014b).
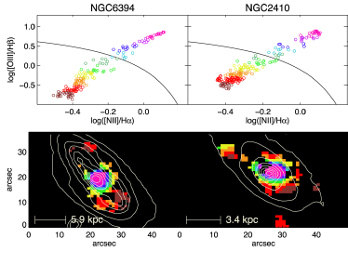 (Top) [N II]/Hα vs. [O III]/Hβ diagnostic diagrams for two galaxies from the CALIFA survey, with spectra colour-coded according to their positions along the mixing sequences. (Bottom) maps of the galaxies with the same colour-coding. We find a strong relationship between positions of spectra along the mixing sequences and their distances from the centres of the galaxies, suggesting that the spread of line ratios along the sequences is driven primarily by AGN fraction variations. Figure modified from Davies+ 2014b.
There is a strong correlation between the positions of spectra along the mixing sequences and their distances from the centres of the galaxies. The spectra with the largest line ratios lie closest to the galaxy centres where the AGN contribution is expected to be the largest, whereas the spectra with the smallest line ratios lie outside of the AGN narrow line region where star formation is dominant. This relationship is strong evidence that the spread in line ratios across the diagnostic diagram is primarily driven by variations in the relative contributions of star formation and AGN activity to the emission line spectra. The fractional contribution of the AGN to the emission line luminosity in any individual spaxel is then approximately proportional to the distance (in line ratio space) of that spaxel along the mixing sequence.
Spatially resolved mixing sequences allow AGN fractions to be calculated with much greater accuracy than can be achieved with global spectra, but some issues remain. The method described above provides only one AGN fraction for each spectrum, but in reality we know that the AGN ionizing radiation field enhances the forbidden line luminosities significantly more than the recombination line luminosities. Accurate separation of star formation and AGN activity requires estimates of the AGN contribution to individual emission lines. We have developed a method to calculate the fractional contribution of the AGN to individual emission lines, and this method will be described in a forthcoming paper. Separating composite spectra into components associated with star formation and AGN activity makes it possible to calculate accurate star-formation rates and AGN accretion rates, and will ultimately allow for spatially resolved studies of the gas conditions in AGN host galaxies.