With Digitizer, you can read in a bitmap, define axes and click on data points. The program will convert the pixel coordinates to plot coordinates and can save them to a tab-delimited text list. Copy and Paste are also supported (e.g. you can directly copy your figure from acrobat and, after digitizing it, paste the data into Excel). The program supports linear and logarithmic axes. The plots can also be tilted (which often happens if they were scanned).
Sorry, none. The program hopefully is quite intuitive to use, though.
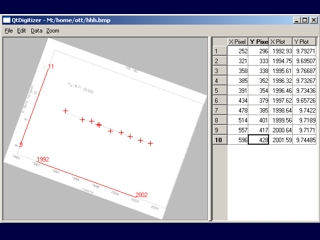
A simple guide to digitize a plot
- Read in a bitmap either by using File->Open or Edit->Paste
(File->Open supports bmp and png on Windows, and additionally jpg and gif on UNIX)
- Define the axes using Data->Define X-Axis and Data->Define Y-Axis
- Left-click on the points you want digitized
- Save your data using either File->Save As or Edit->Copy
- Right-click on points to delete them
For Microsoft Windows, you need this binary (70 kB) and the QT library (2.59 MB). Just put both files in a common directory.
For Linux, you need this binary (3.1 MB).
For MacOS, download this disk image (5.2 MB). This is a Universial binary.
Revision history
Wish list for future improvements