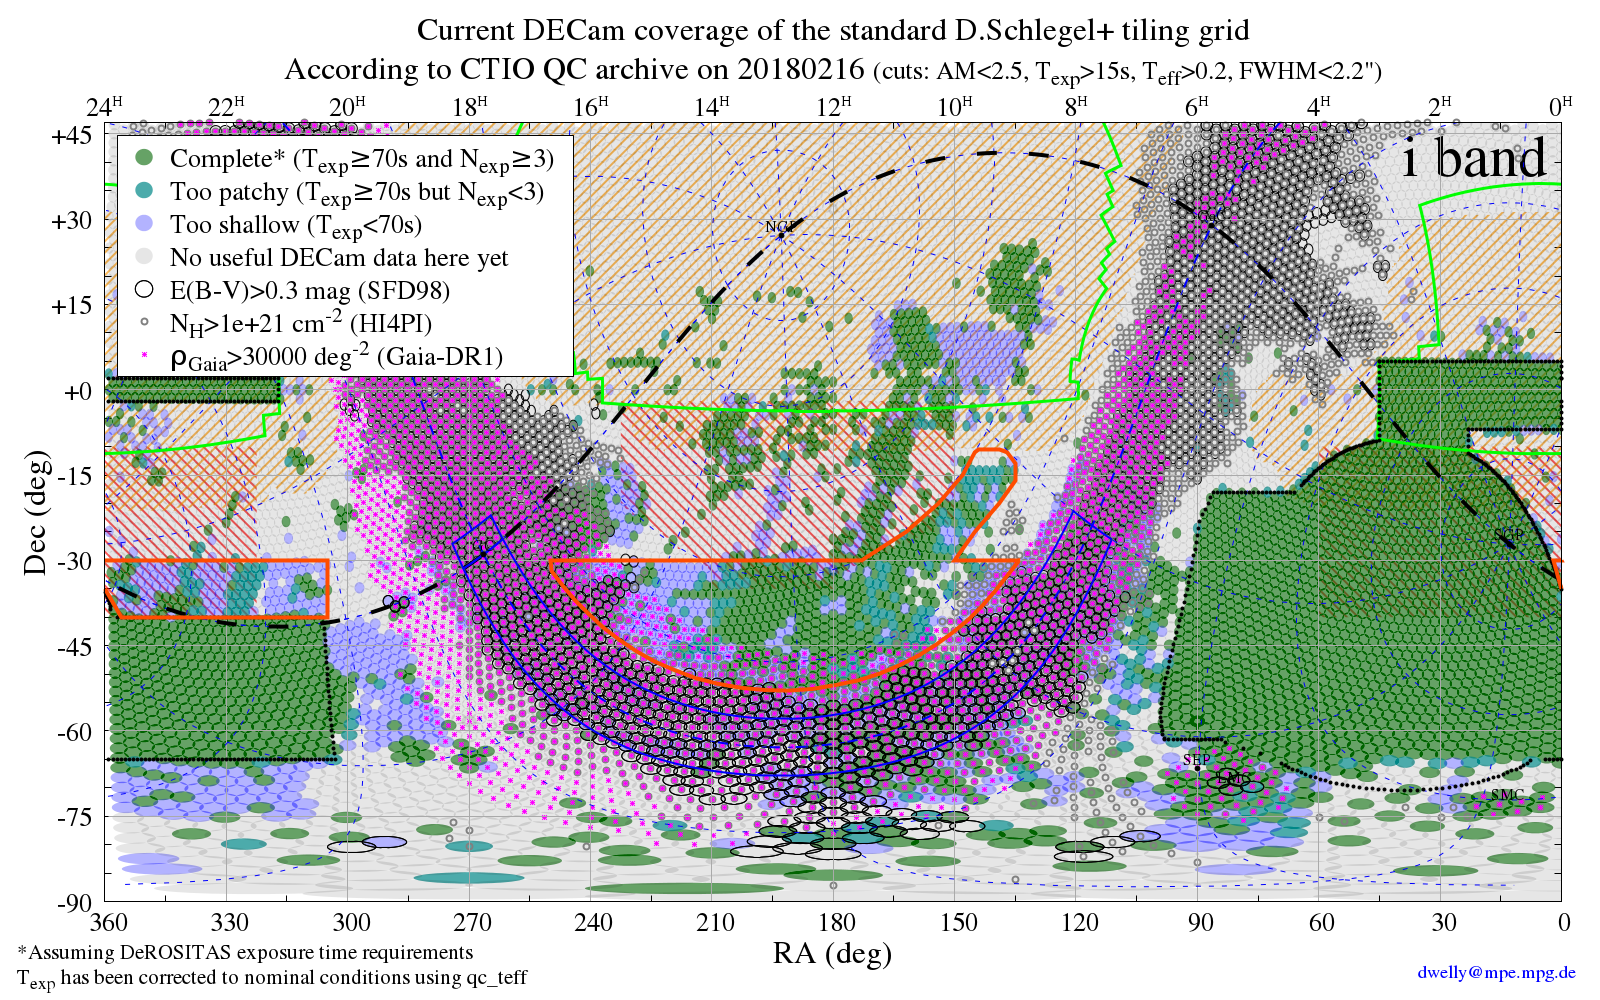
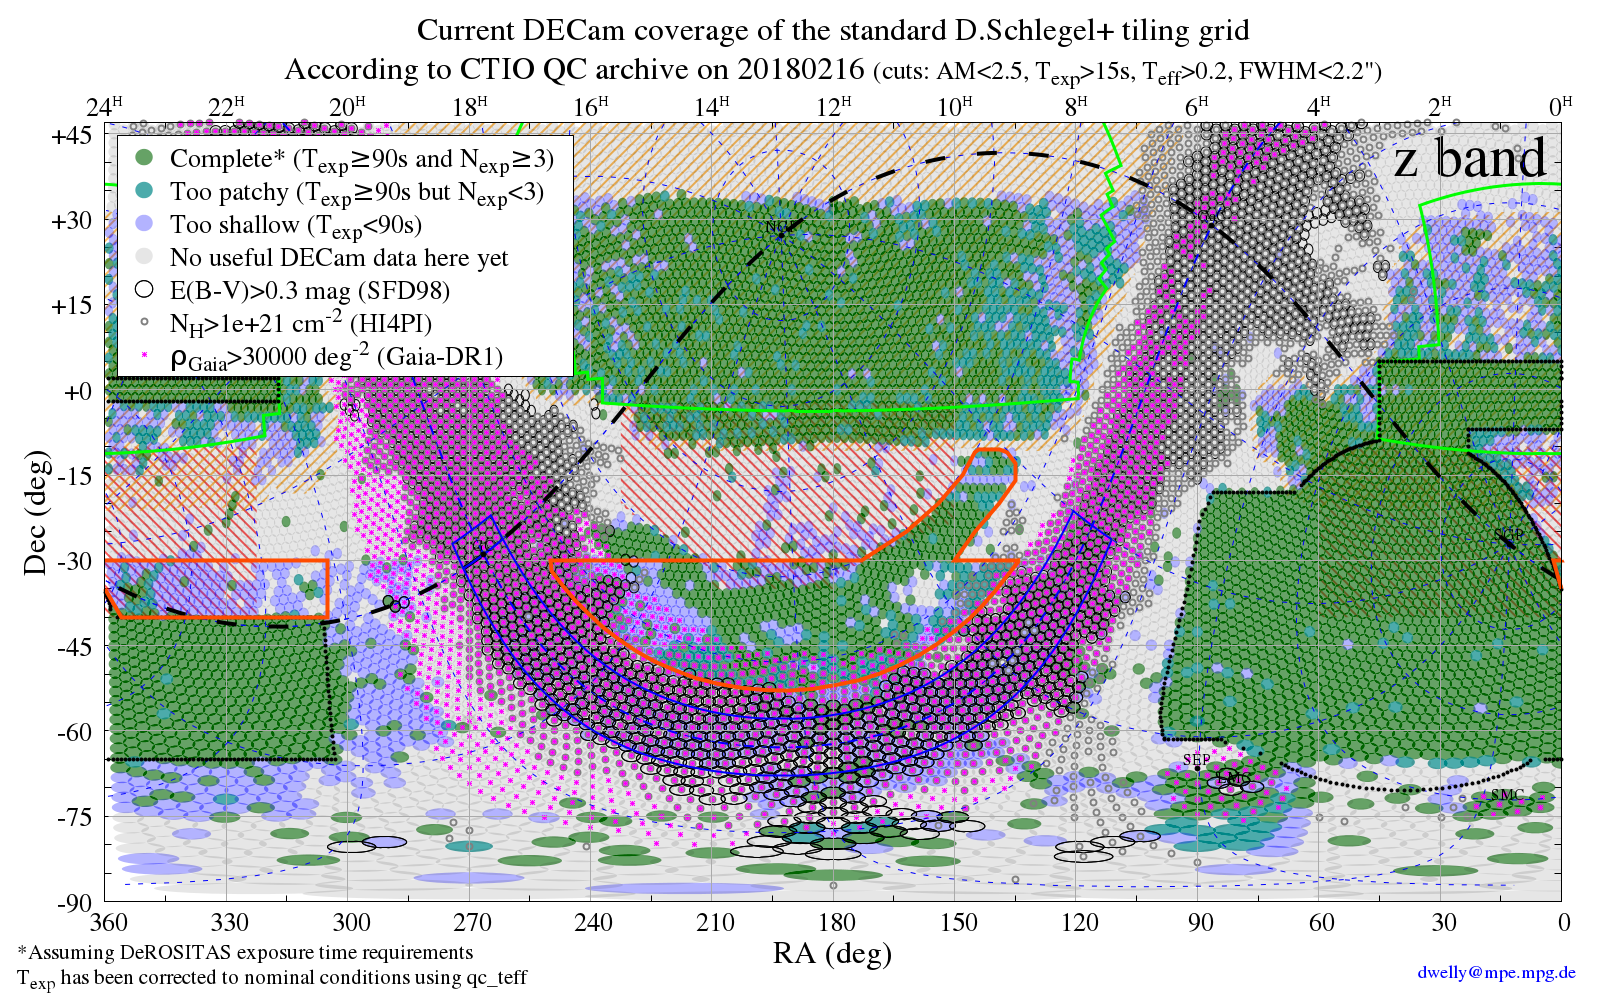
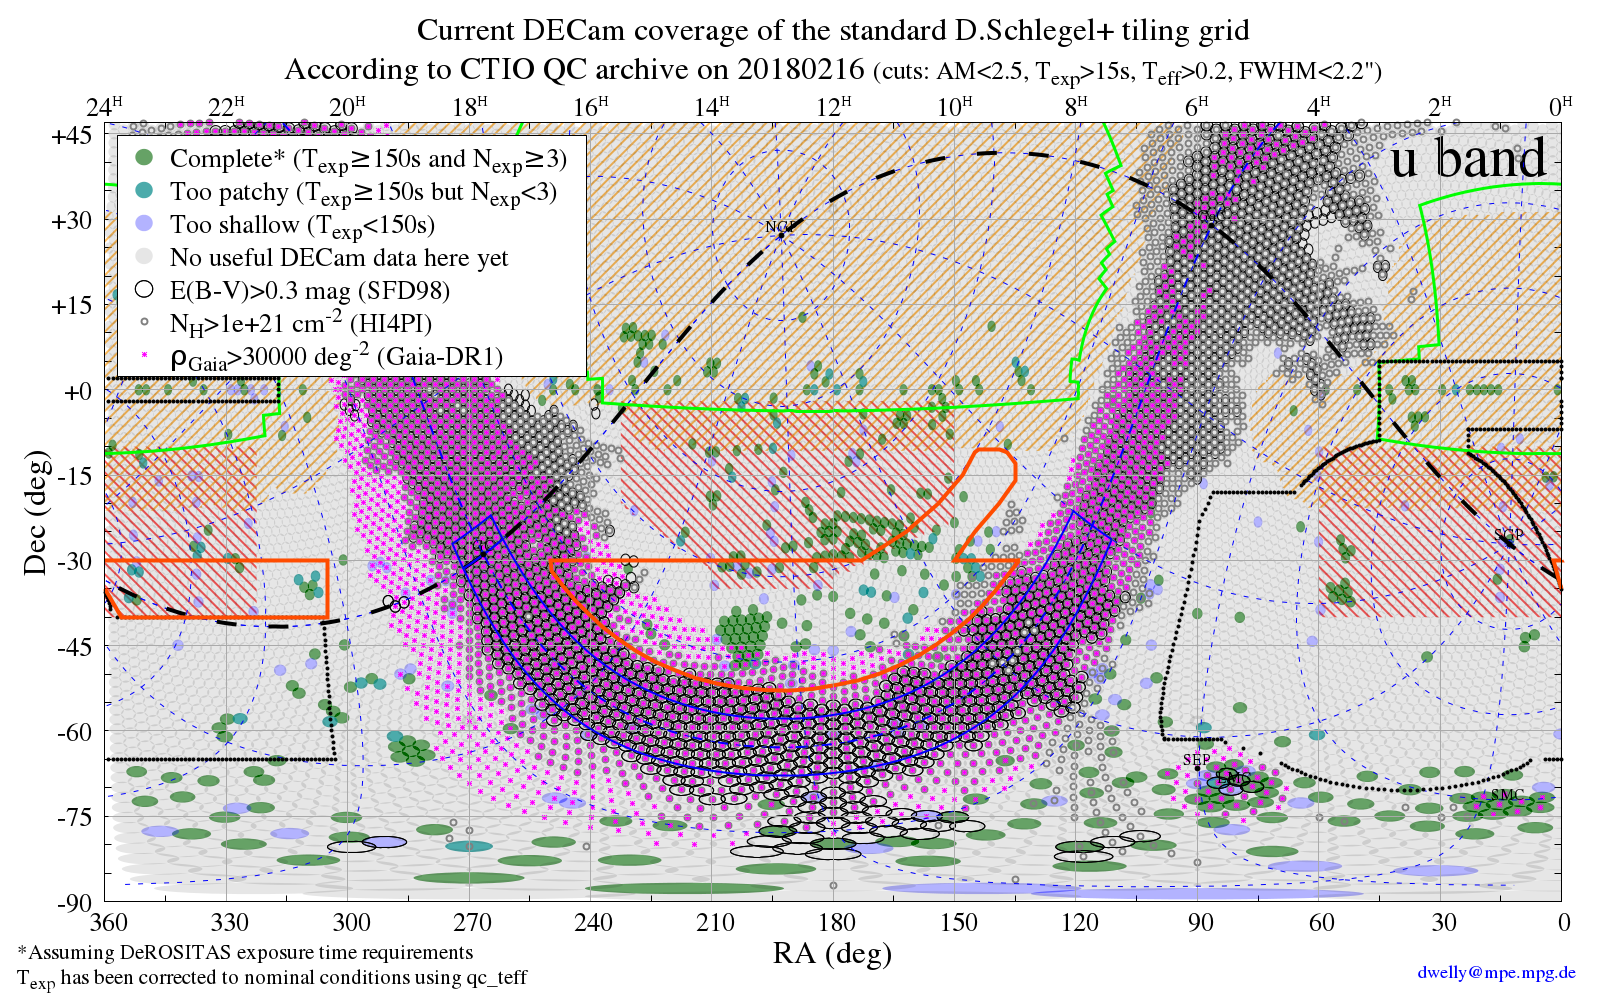
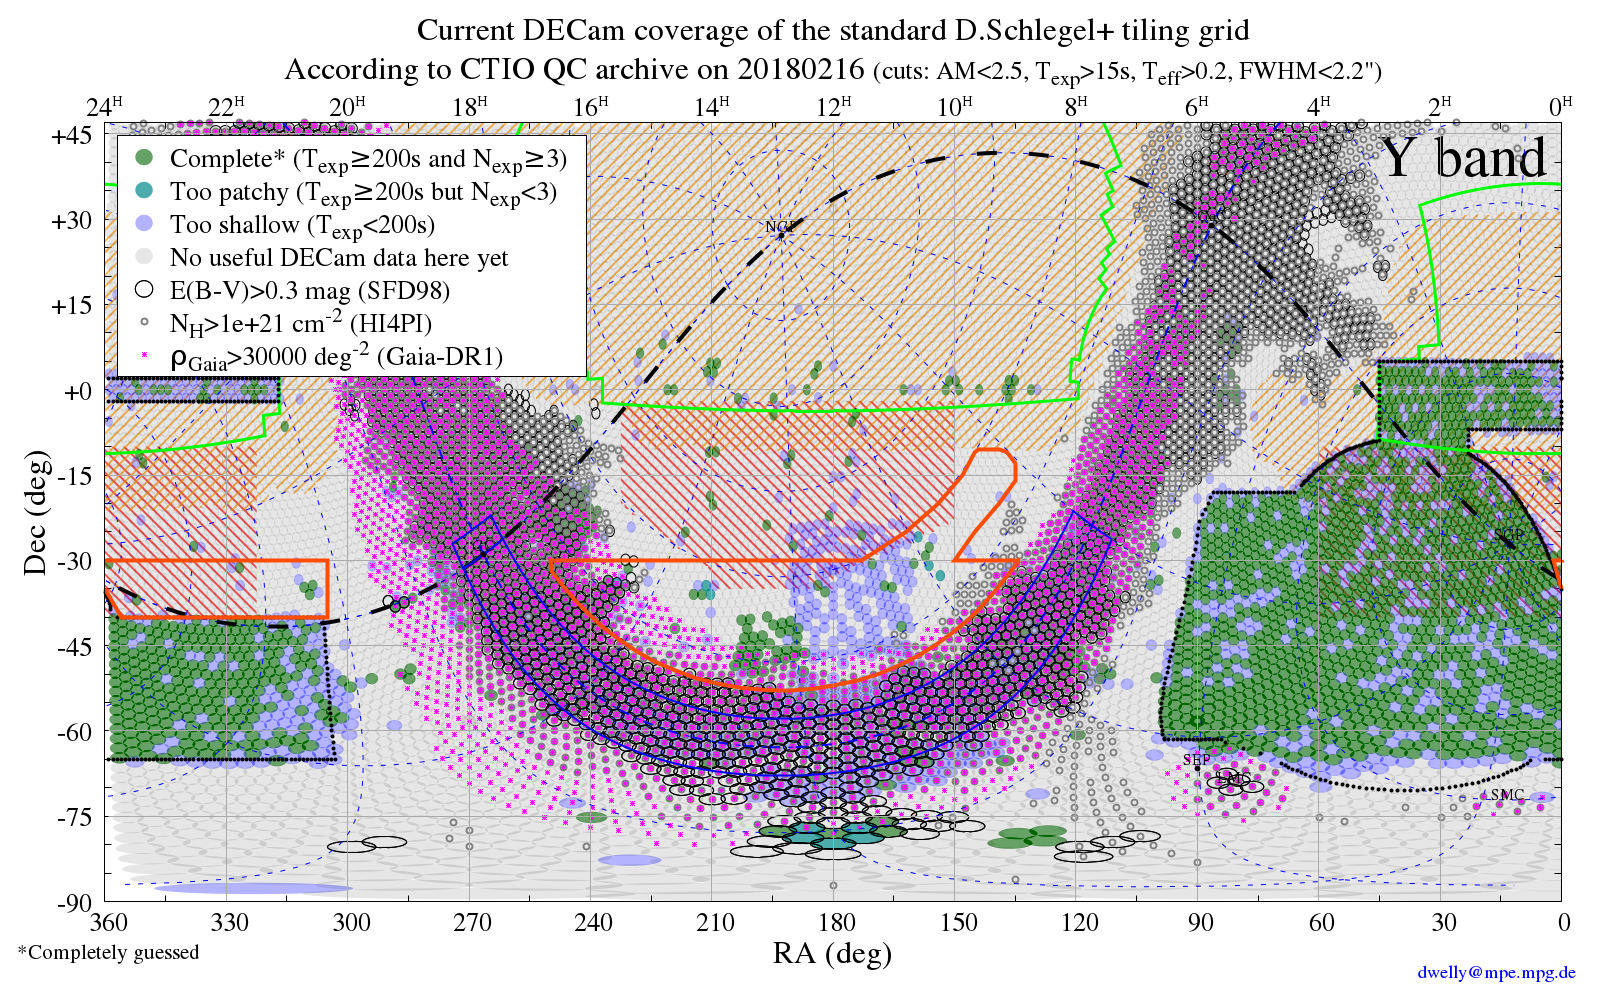
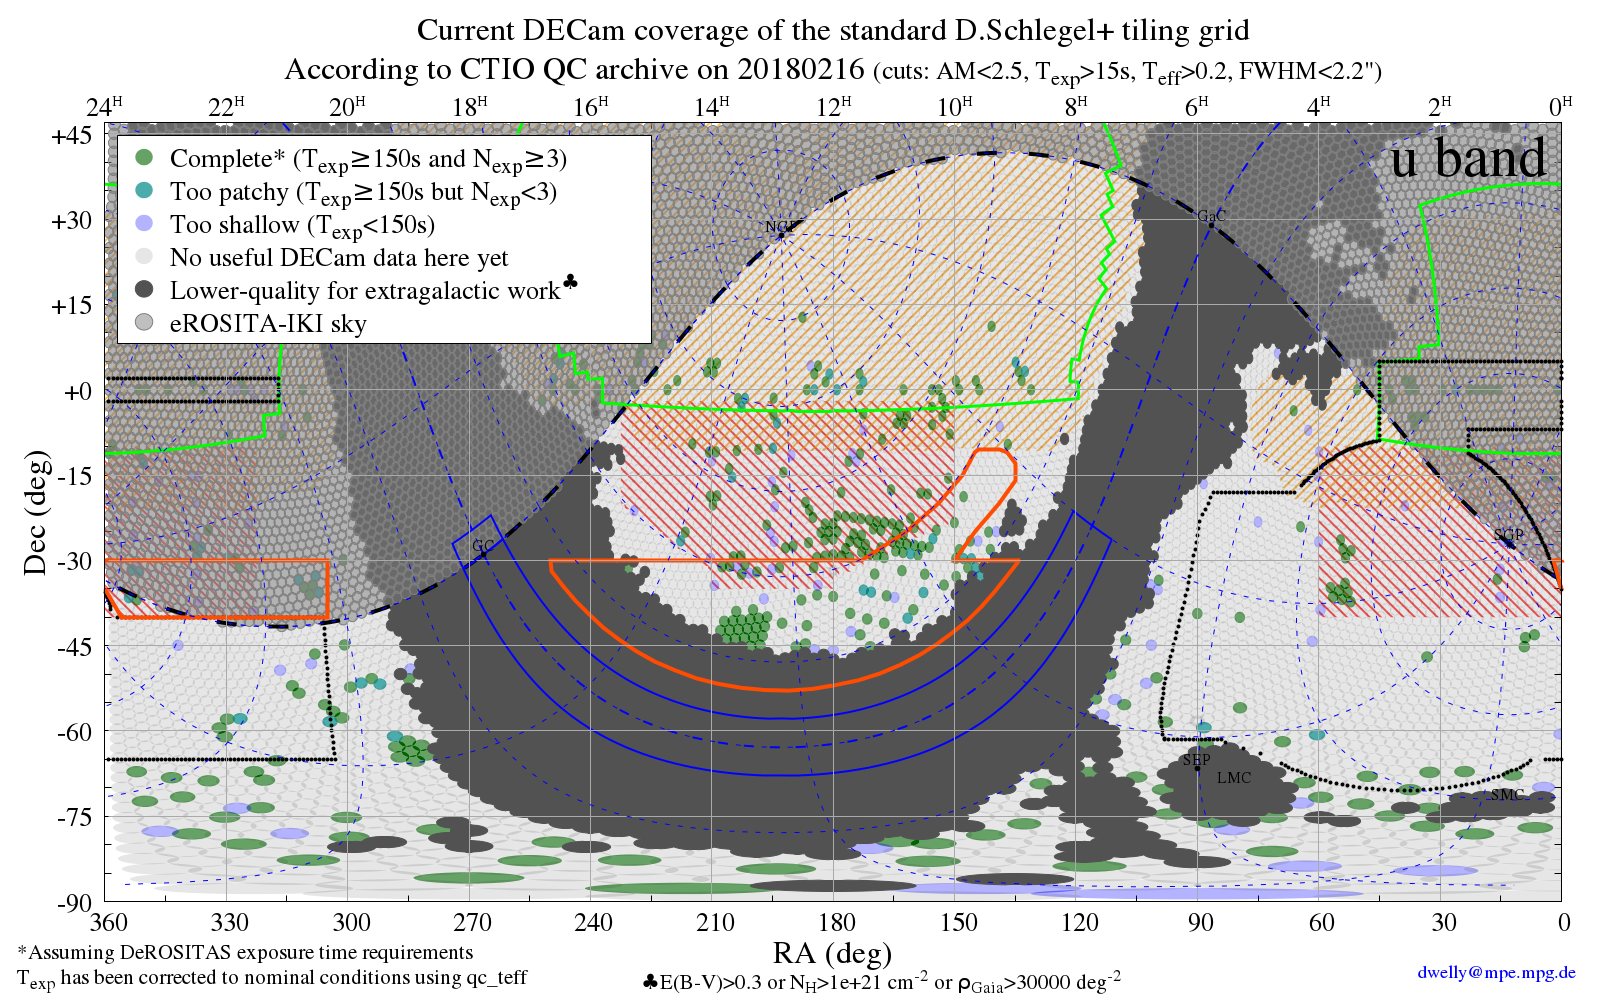
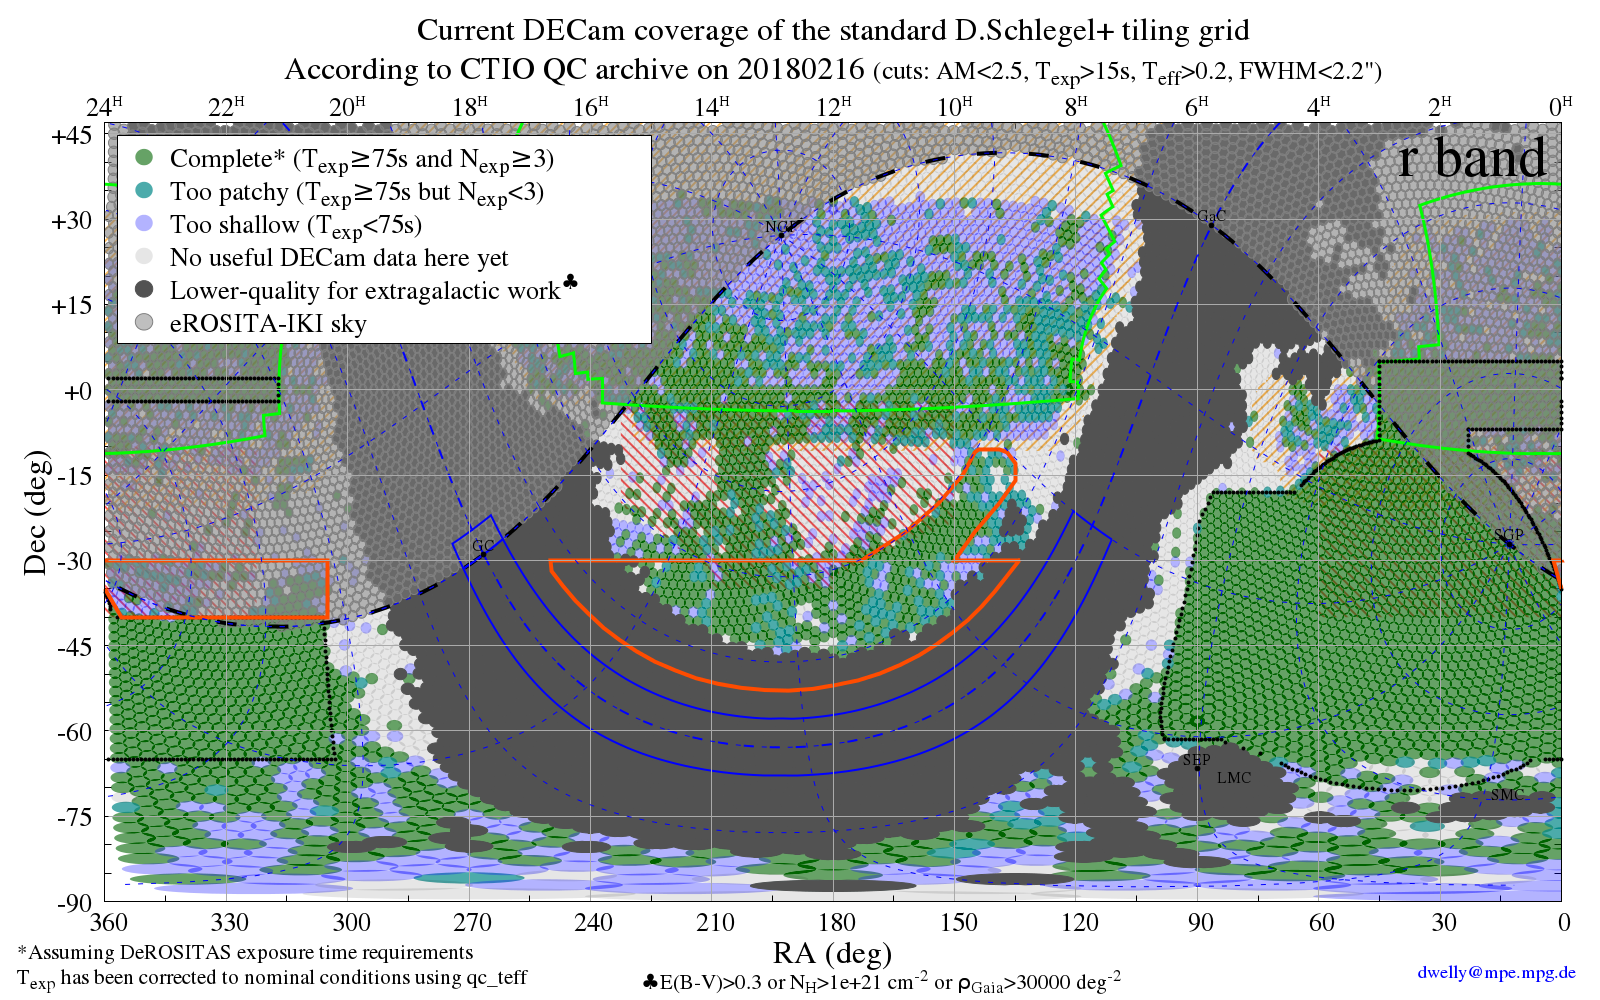
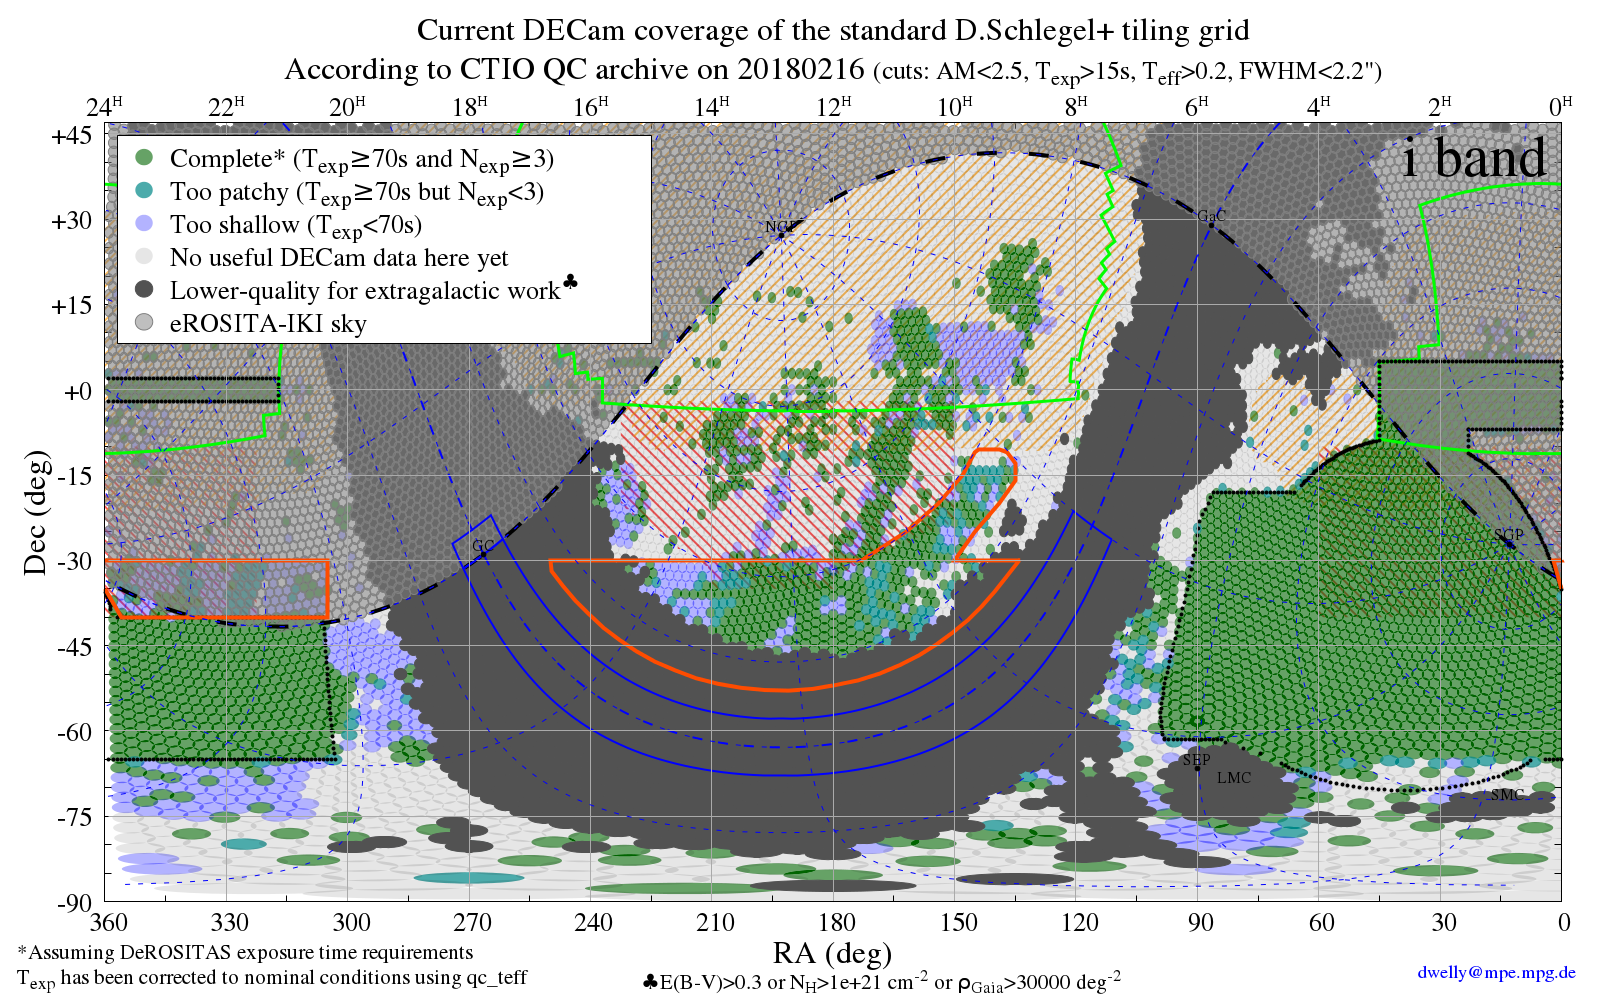
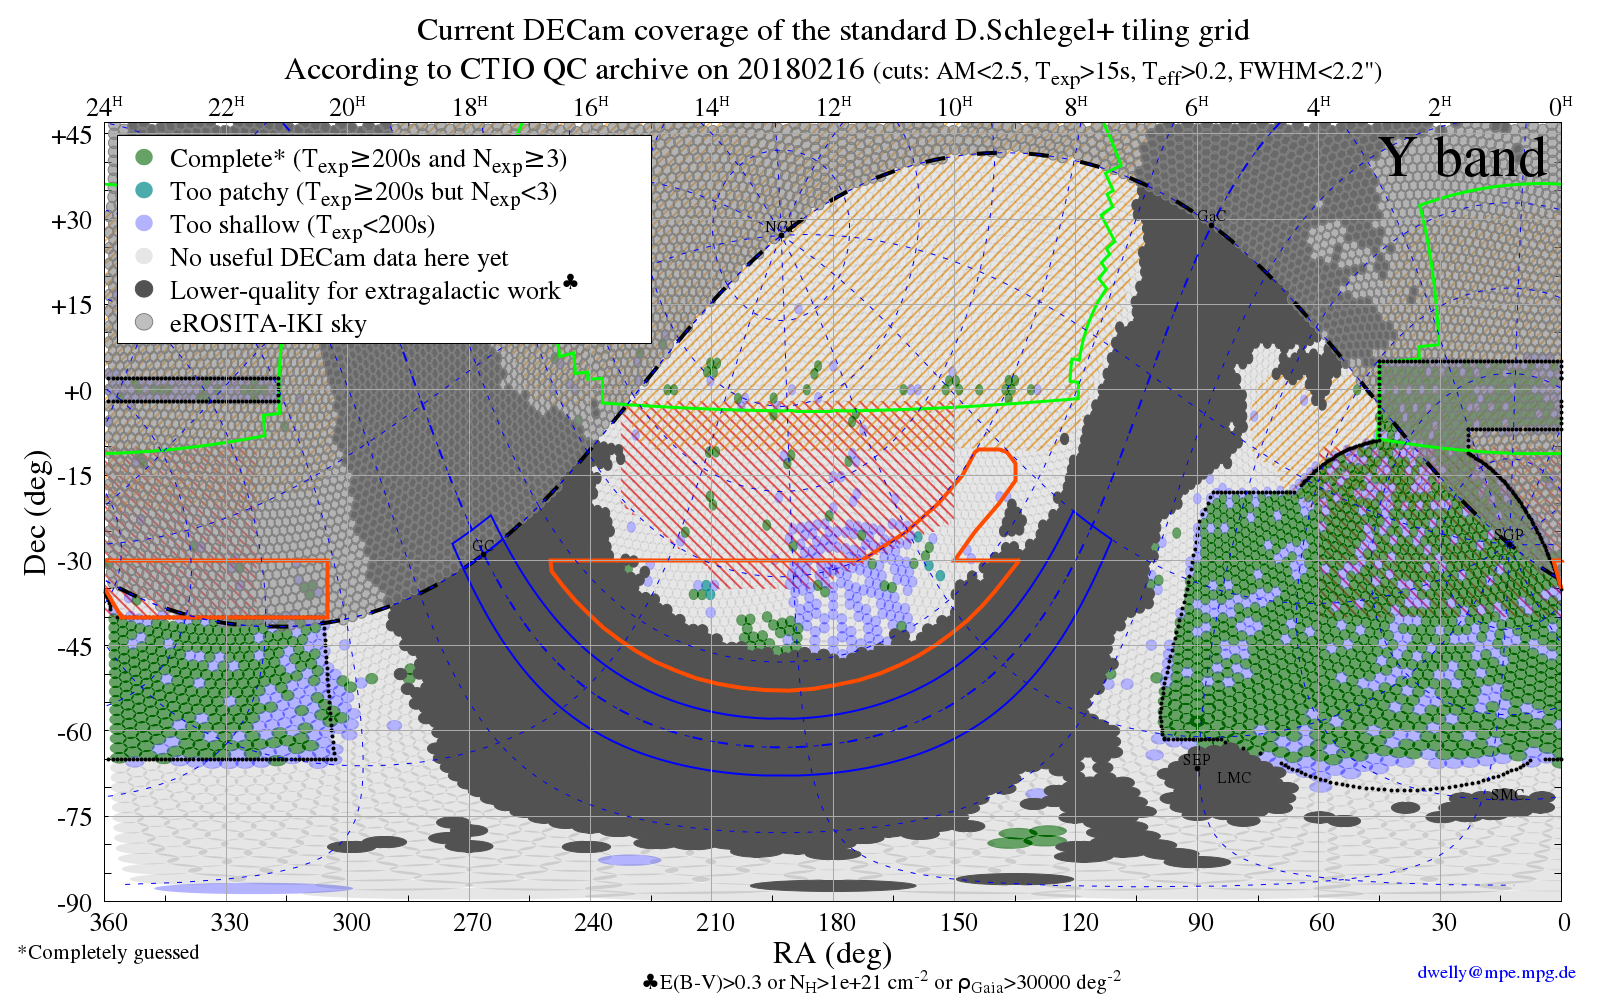
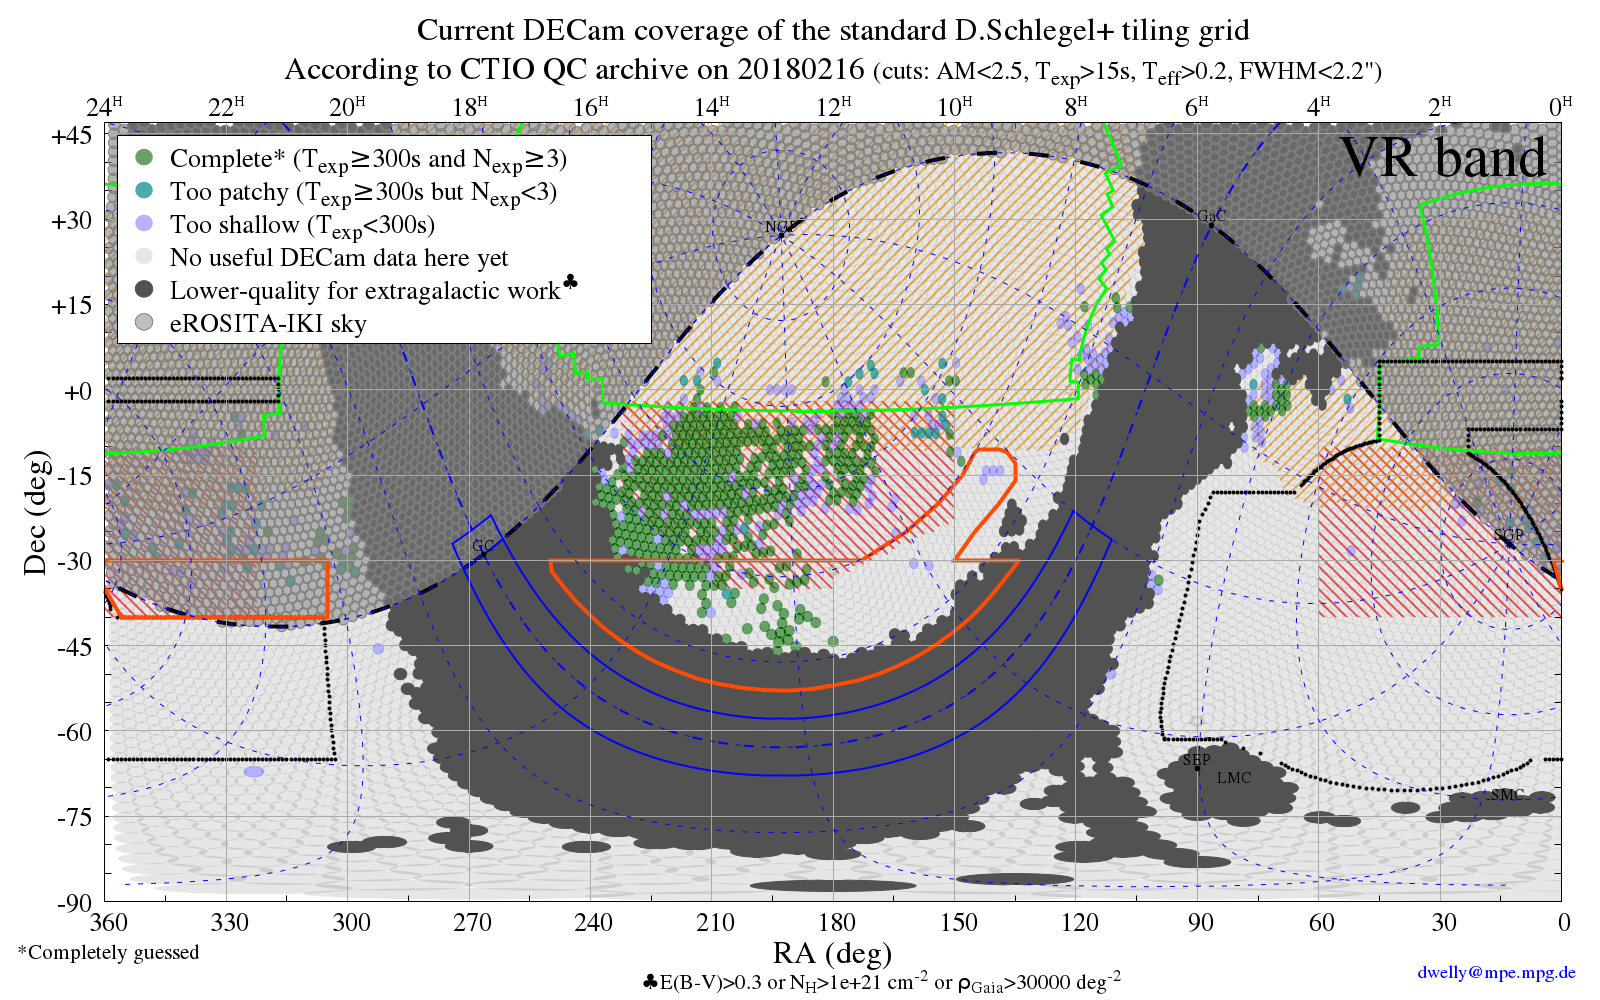
The figures below illustrate the parts of the eROSITA-DE sky which have been already observed by DECam according to a dump of the CTIO QC database (query made by A.Zenteno on 2018-02-16). Note that it is possible that there are some DECam observations in the public NOAO science archive which do not have qc entries available in the CTIO DB. Some light data quality filtering has been applied according to the available archival parameters (AM<2.5, Texp=15s, obstype="object", Teff>0.2, FWHM<2.2arcsec). Some of these data are currently proprietary. The effective exposure time for each DECam observation is computed as "exposure*qc_teff". The figure shows which of the standard DECaLS/BLISS/DECaPS/DeROSITAS/etc tiling grid points (3*15872 tiles over the full sky, computed by D.Schlegel et al. for DECaLS) lie within 55arcmin of at least 3 DECam exposures with total effective exposure time above the indicated thresholds. The plots only show the results for "PASS==1" of the tiling pattern. This conservative choice of radius results in some extra holes beyond what we would obtain by adopting the nominal FOV of the DECam instrument (2deg diam). A more accurate picture of actual coverage can be estimated by resampling the DECam focal plane layout down onto a HEALPIx grid at the locations of each observation.
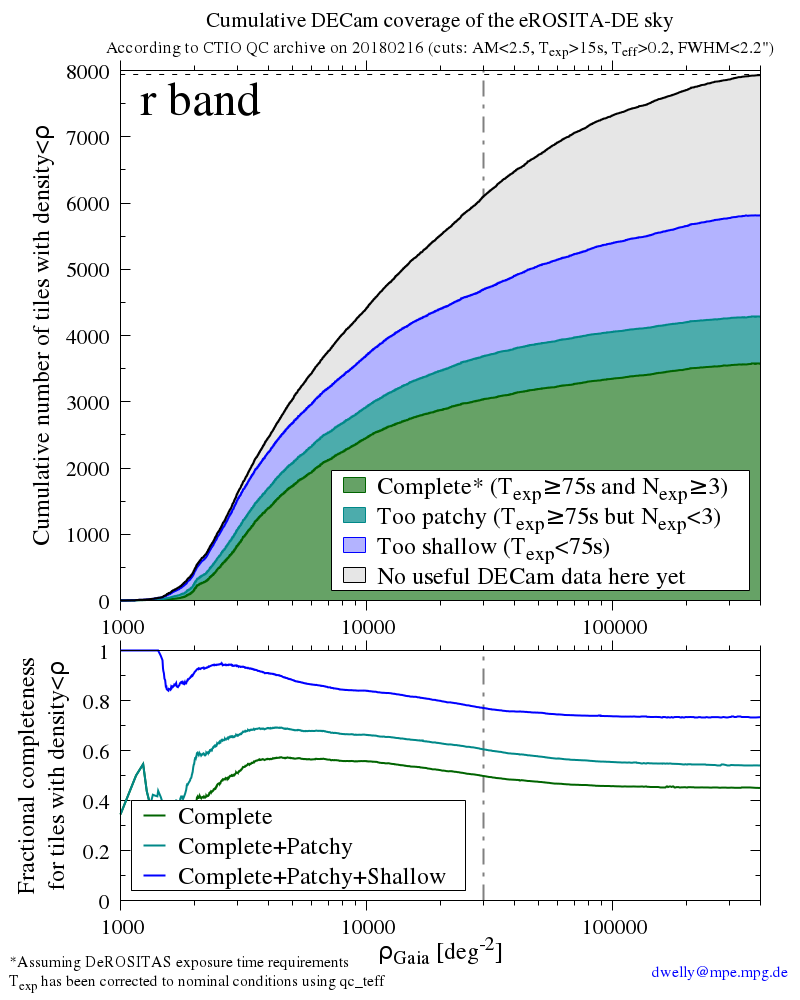
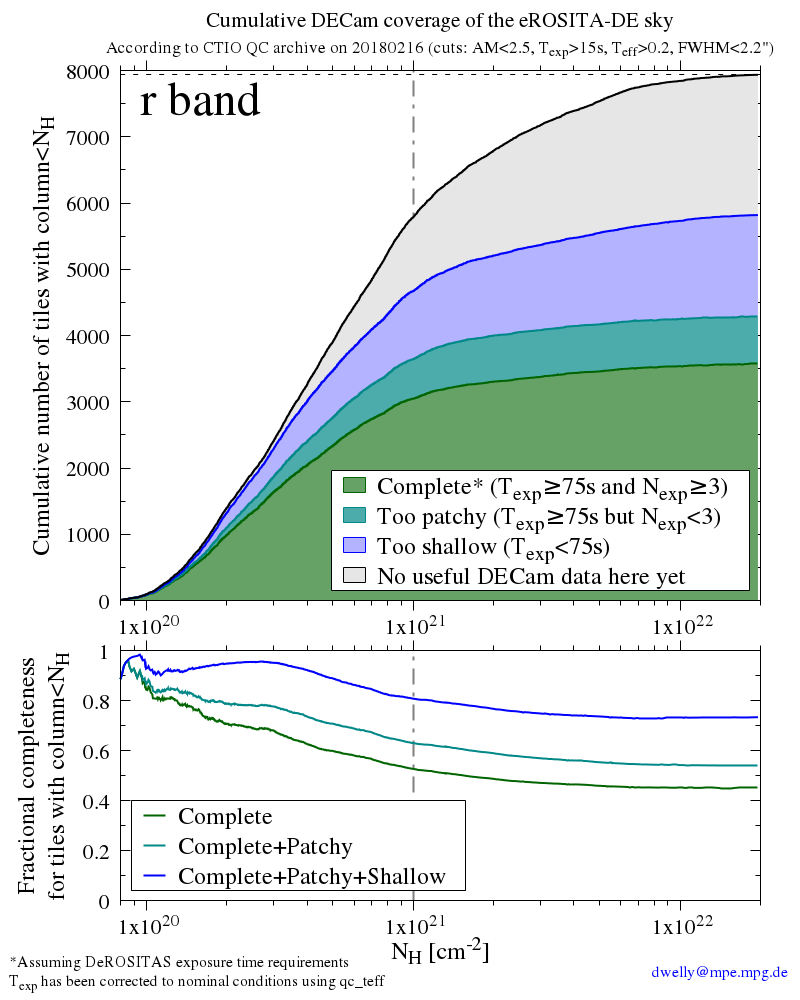
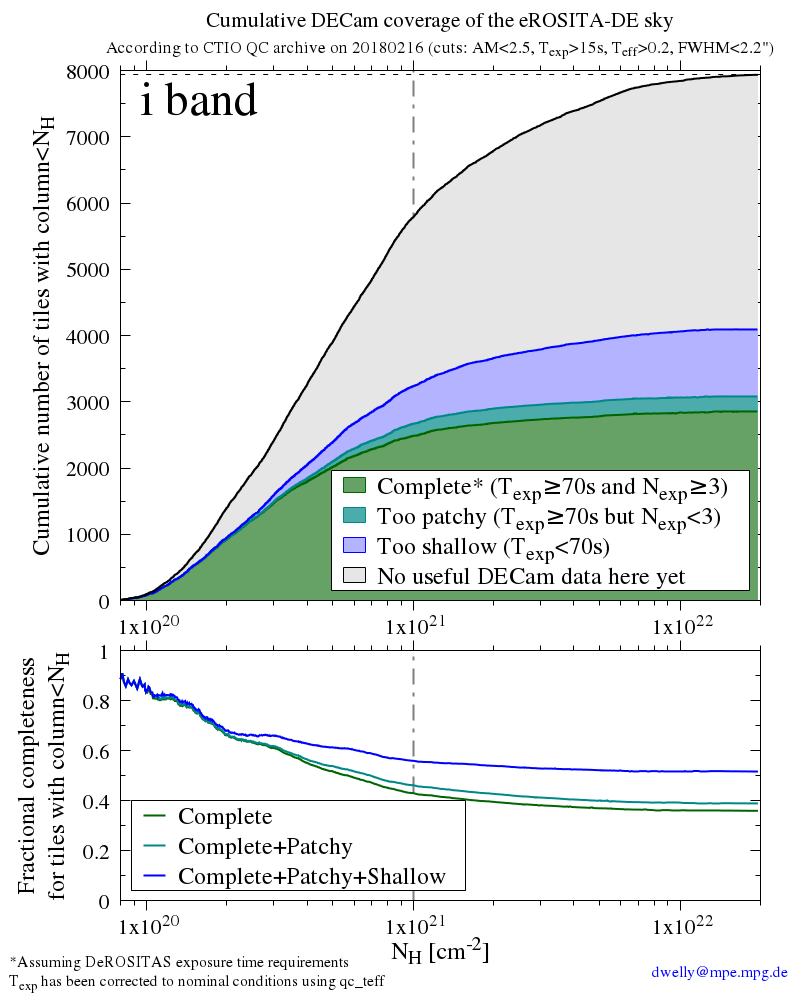
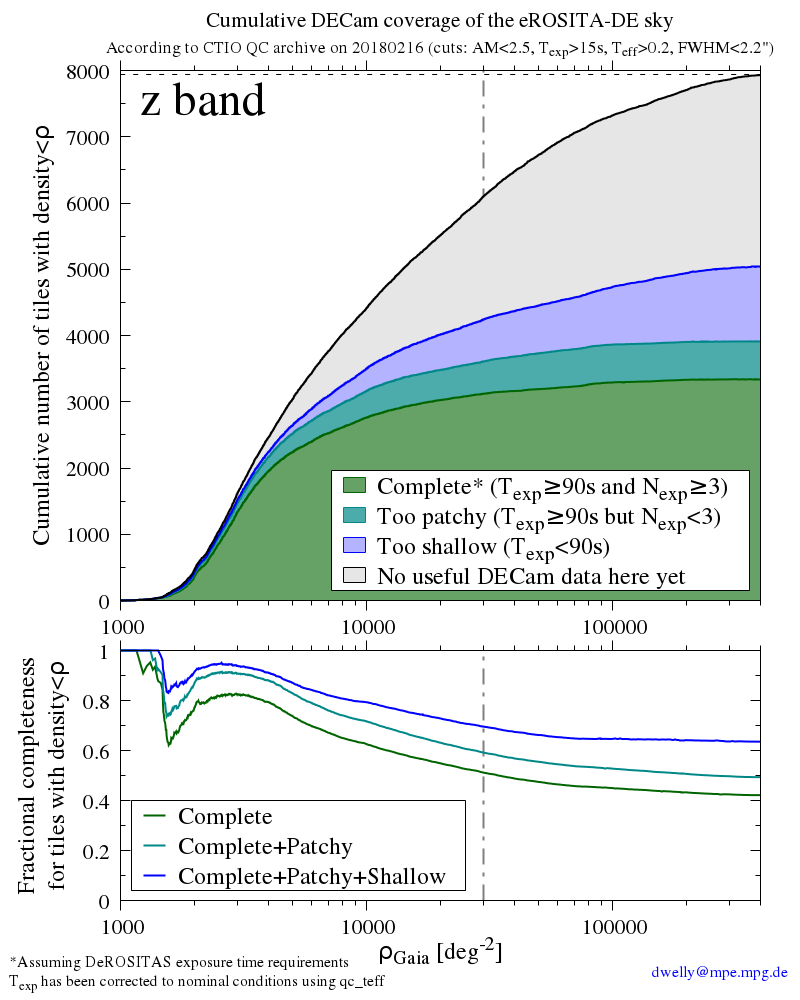
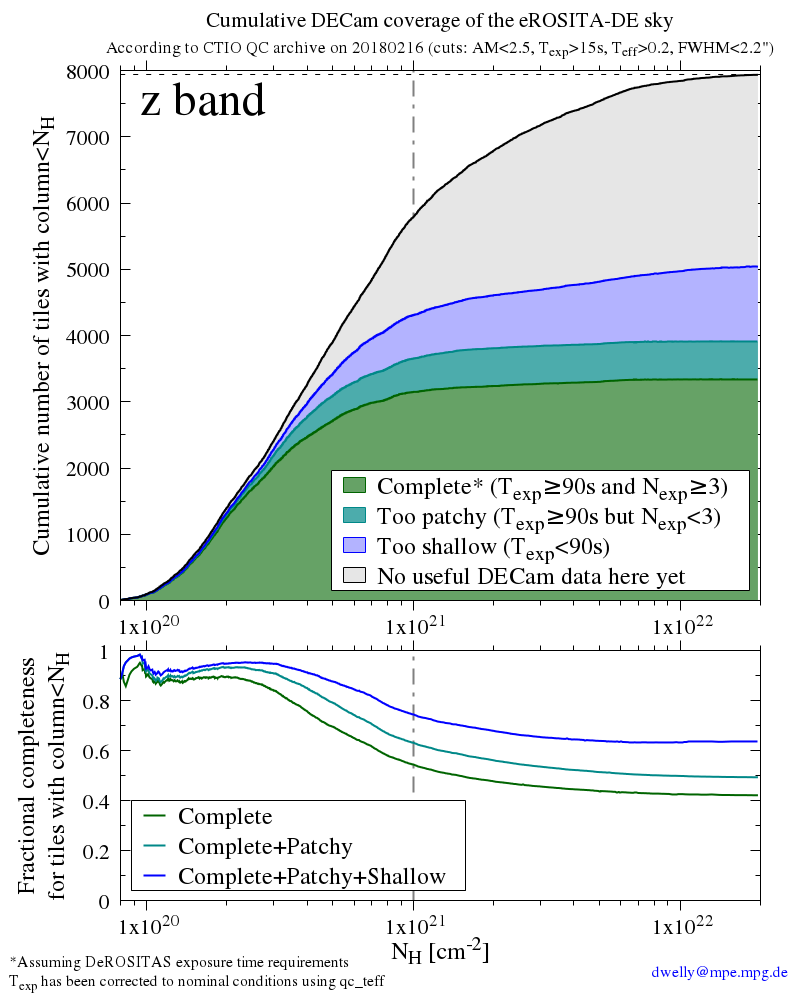
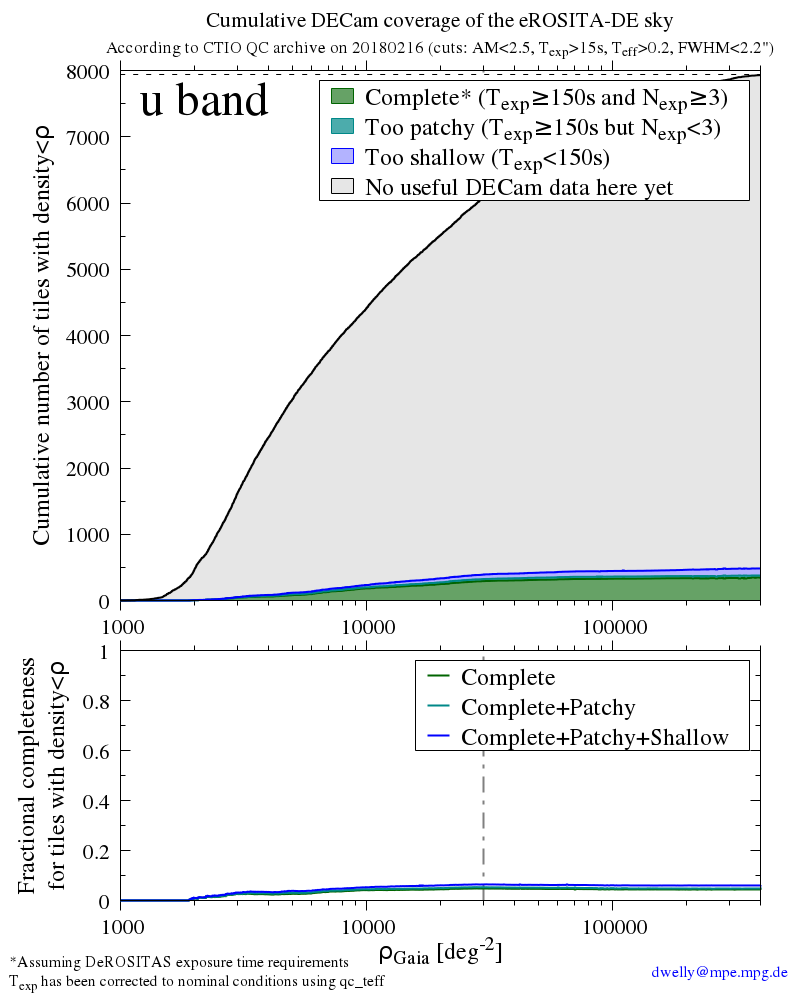
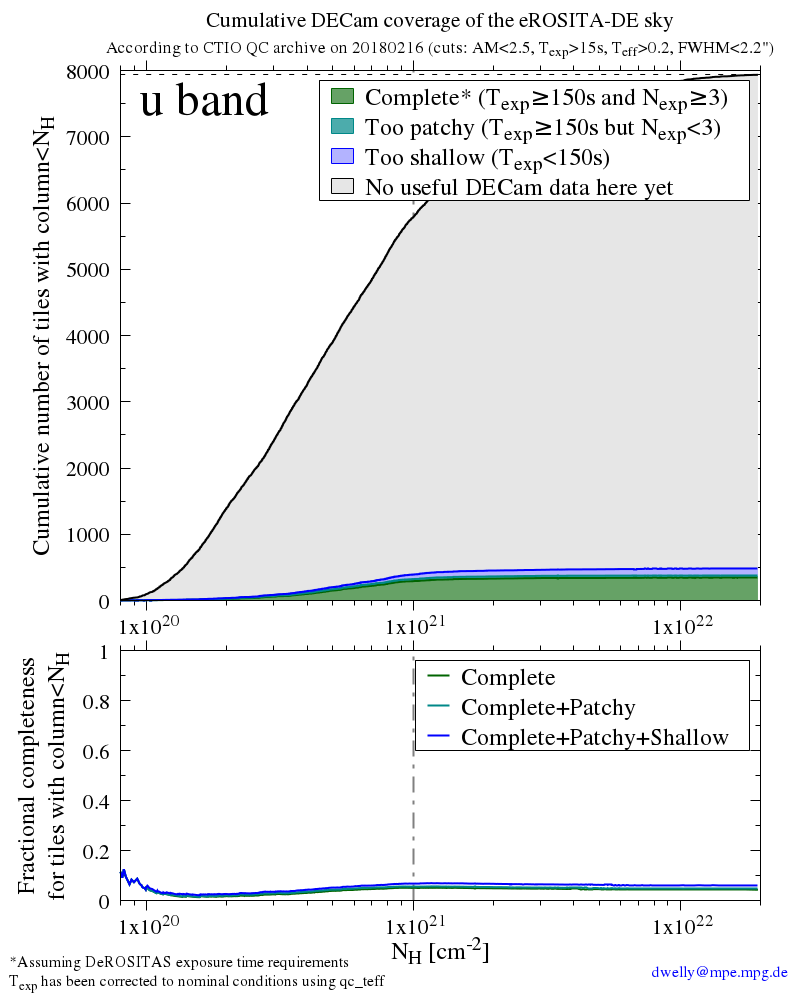
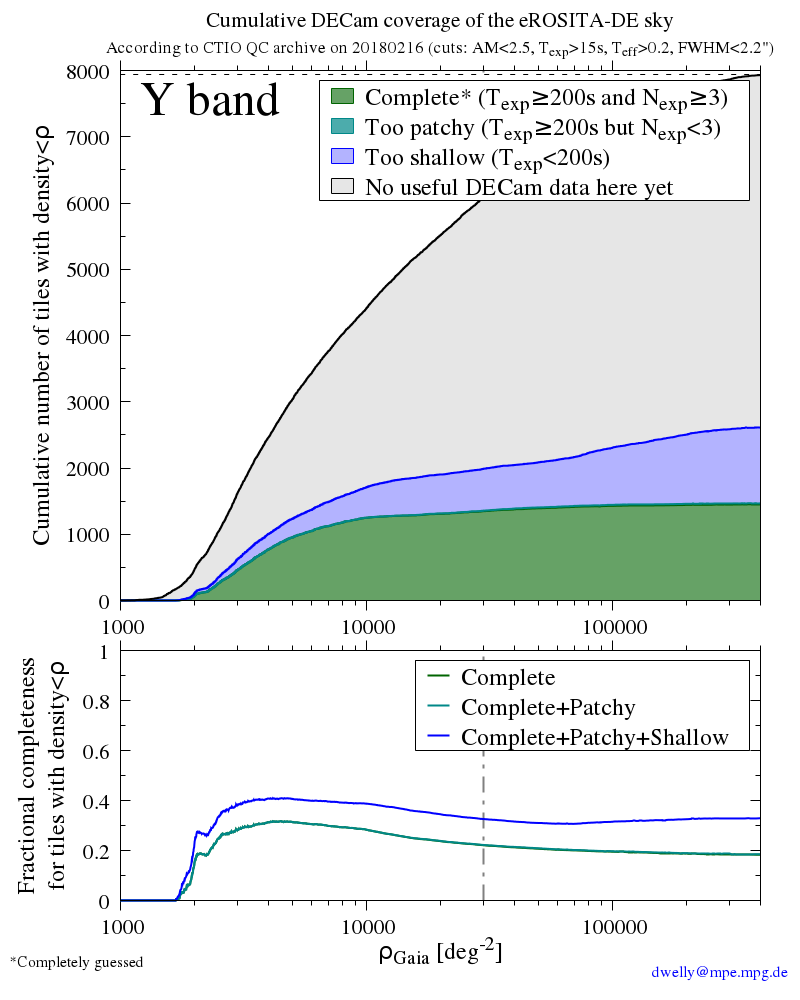
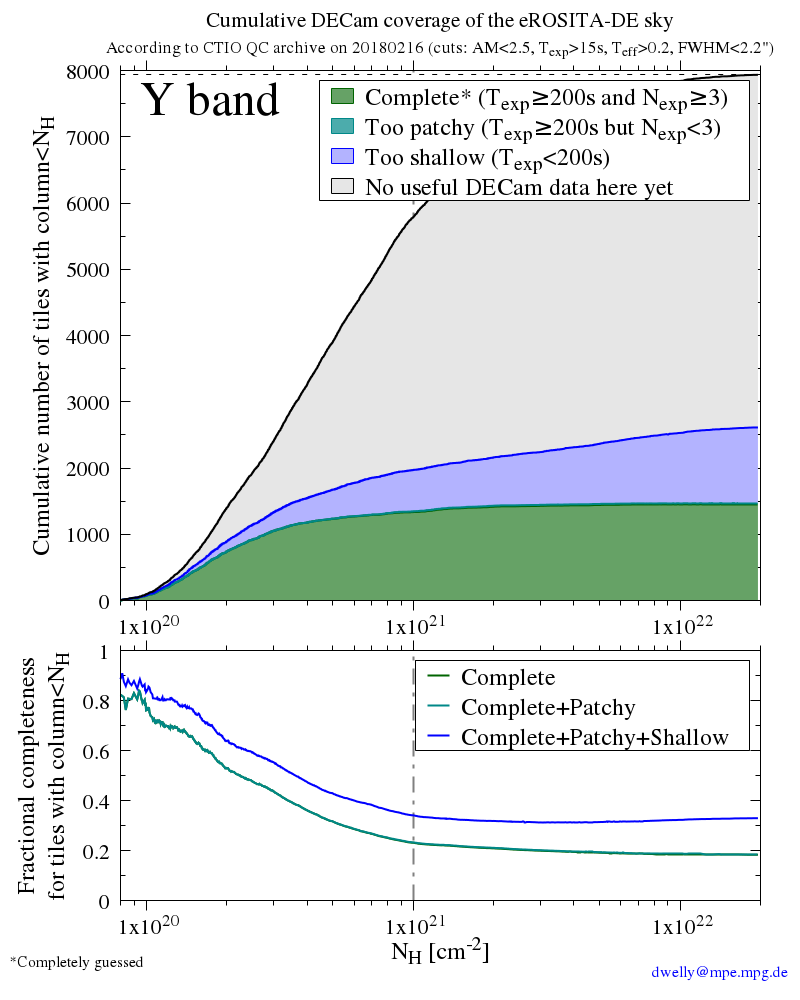
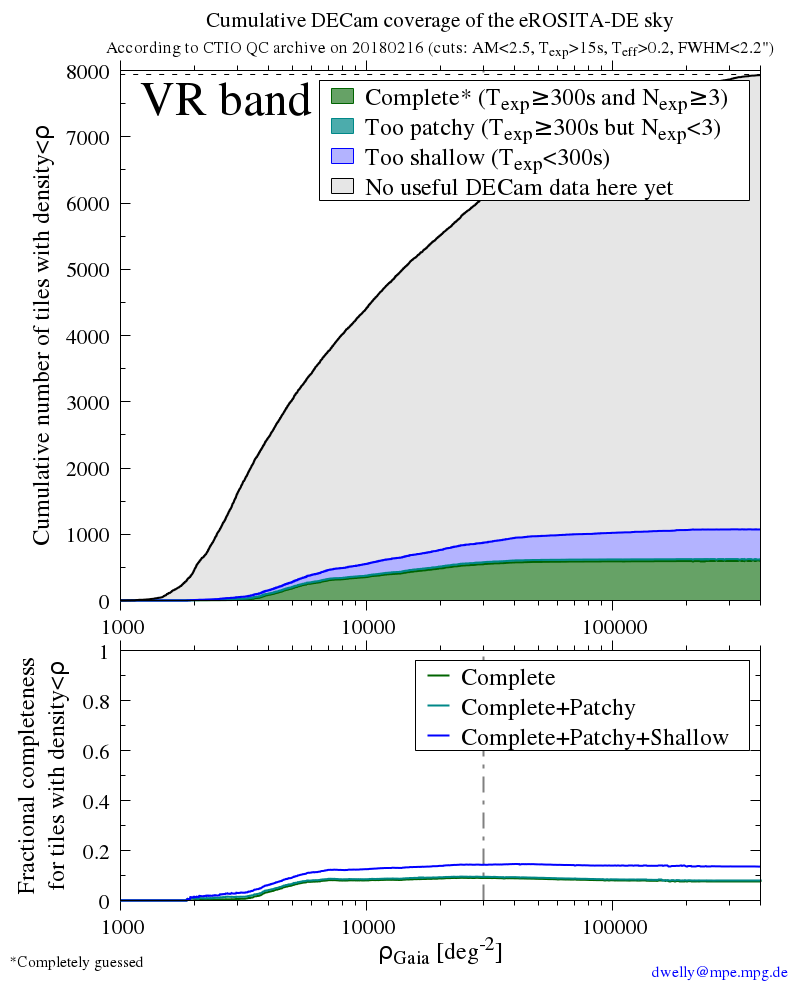
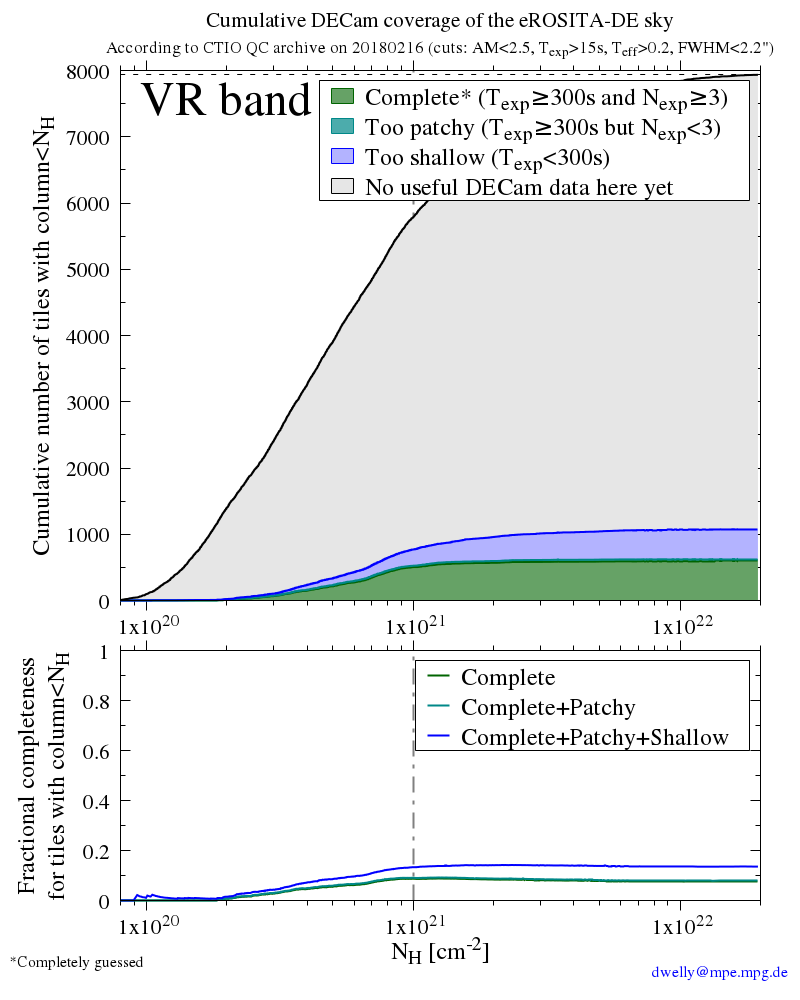
Since we do now have a good idea of the quality (i.e. IQ, transparency) of these observations, the threshold exposure time for "completeness" (Tthresh) is set to be 100% of the DeROSITAS (PI: A.Zenteno) exposure depths computed for nominal dark conditions (g=25s;r=75s;i=70s;z=90s), and is arbitrarily set to be 300s in the u band, 200s in the Y band and 300s in the VR band.
We consider sky as "Complete" when Texp>=Tthresh and Nexp>=3. Patchy sky has sufficient total exposure time, but too few exposures (Texp>=Tthresh and Nexp<3). Shallow sky has Texp < Tthresh.
Please contact dwelly --at-- mpe.mpg.de if you have any questions
The FITS data file containing the summary coverage info per tile is here: (decam_tiles_withqcobs*.fits.gz). It has the following format:
| Column | Name | Format | Description |
|---|---|---|---|
| 1 | DTILING_TILEID | J | ID number of this tile |
| 2 | DTILING_RA | D | deg, J2000 |
| 3 | DTILING_DEC | D | deg, J2000 |
| 4 | DTILING_PASS | I | 1, 2, or 3 |
| 5 | DTILING_IN_SDSS | I | =1 if in SDSS footprint |
| 6 | DTILING_IN_DES | I | =1 if in DES footprint |
| 7 | DTILING_IN_DESI | I | =1 if in DESI footprint |
| 8 | DTILING_EBV_MED | E | mag, extinction from SFD'98 |
| 9 | DTILING_NH_LAB | D | cm-2, from Lambda map (LAB?) |
| 10 | DTILING_NH_HI4PI | D | cm-2, from HI4PI map (HI4PI Collaboration+, 2016) |
| 11 | DTILING_RHO_2MASS | D | objects deg-2, from 2MASS |
| 12 | DTILING_RHO_GAIADR1 | D | objects deg-2, from Gaia-DR1 |
| 13 | DTILING_IN_ERO_DE | 1I | =1 if in German half of eROSITA sky (180<=l<=360 deg) |
| 14 | DTILING_IN_BLISS | 1I | =1 if in BLISS goal footprint |
| 15 | DTILING_IN_DECaPS | 1I | =1 if in DECaPS goal footprint |
| 16 | DTILING_IN_MagLiteS | 1I | =1 if in MagLiteS goal footprint |
| 17 | DTILING_IN_VST_ATLAS | 1I | =1 if in nominal VST/ATLAS footprint |
| 18 | DTILING_IN_VST_KiDS | 1I | =1 if in nominal VST/KiDS footprint |
| 19 | DTILING_IN_HSC_WIDE | 1I | =1 if in nominal Subaru HyperSuprimeCam Survey-Wide footprint |
| 20 | OBS_NEXP_u | 1J | Number of DECam u-band exposures meeting criteria within search radius |
| 21 | OBS_TEXP_u | 1E | Summed effective exposure time (s) of DECam u-band exposures meeting criteria within search radius |
| 22 | OBS_NEXP_g | 1J | same as OBS_NEXP_u, but for g-band |
| 23 | OBS_TEXP_g | 1E | same as OBS_TEXP_u, but for g-band |
| 24 | OBS_NEXP_r | 1J | same as OBS_NEXP_u, but for r-band |
| 25 | OBS_TEXP_r | 1E | same as OBS_TEXP_u, but for r-band |
| 26 | OBS_NEXP_i | 1J | same as OBS_NEXP_u, but for i-band |
| 27 | OBS_TEXP_i | 1E | same as OBS_TEXP_u, but for i-band |
| 28 | OBS_NEXP_z | 1J | same as OBS_NEXP_u, but for z-band |
| 29 | OBS_TEXP_z | 1E | same as OBS_TEXP_u, but for z-band |
| 30 | OBS_NEXP_Y | 1J | same as OBS_NEXP_u, but for Y-band |
| 31 | OBS_TEXP_Y | 1E | same as OBS_TEXP_u, but for Y-band |
| 32 | OBS_NEXP_VR | 1J | same as OBS_NEXP_u, but for VR-band |
| 33 | OBS_TEXP_VR | 1E | same as OBS_TEXP_u, but for VR-band |
Below are gzipped FITS files containing the catalogue of all observations in each filter. Columns 1-24 are those returned by the public NOAO archive server (see the schema here). Column 25 "seq_id" is derived from "dtacqnam", and colums 26-38 are from the CTIO QC database, (prefixed by "DQ_").
| u-band | g-band | r-band | i-band | z-band | Y-band | VR-band |
I also overlay a few relevant survey footprints: light salmon hashed area = DESI targeting region; green solid line = BOSS imaging footprint; orange solid line = BLISS footprint; blue solid line = DECaPS; red hashed area = VST-ATLAS; black dotted outline = DES. The eROSITA DE/RU boundary is indicated by a thick black dashed line, with German sky to the South. Tiles suffering from strong Galactic dust reddening, E(B-V)>0.3mag, are outlined in black, those with high stellar density (ρGaia>30000 deg-2) are shown with magenta stars, and those with large Galactic absorbing columns (NH>1021 cm-2) are shown with grey circles.
| g | r |
|---|---|
 |
 |
| i | z |
 |
 |
| u | Y | VR |
|---|---|---|
 |
 |
 |
| u | g | r | i | z | Y | VR |
|---|---|---|---|---|---|---|
 |
 |
 |
 |
 |
 |
 |
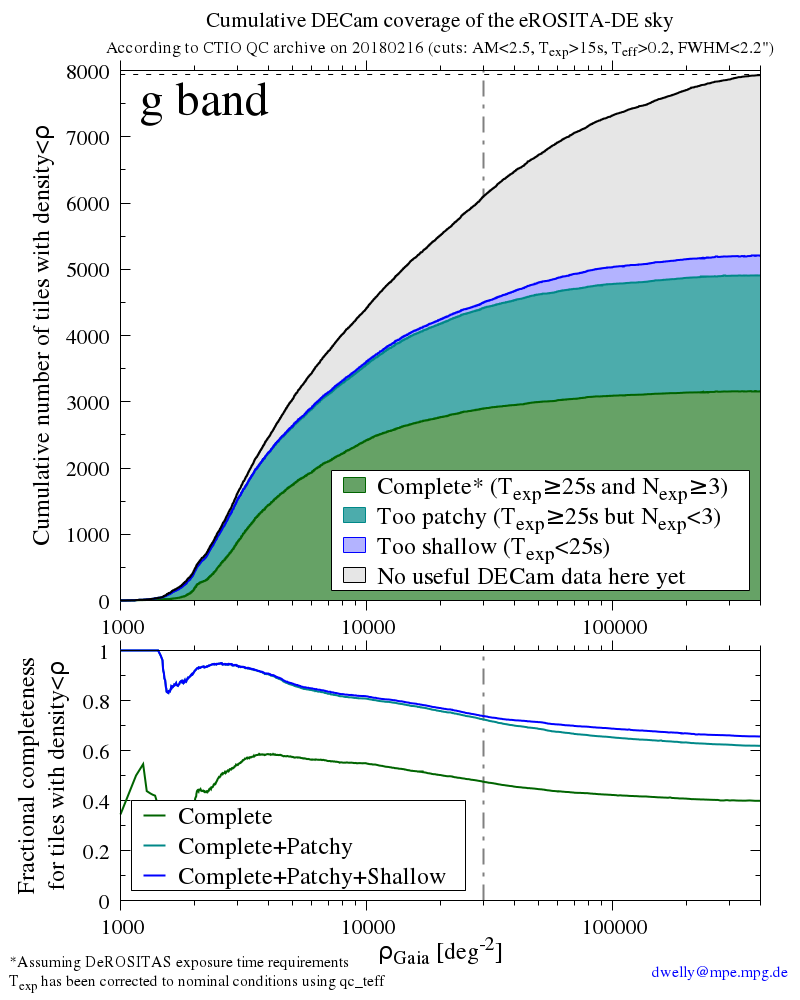
The following plots show the cumulative sky area coverered by existing DECam observations, as a function of the local Galactic dust redenning, E(B-V), Gaia-DR1 source density, and Galactic column density NH. Note that there are 15872 tilings in each 'PASS' over the full sky (2.6 deg2/tile), and 7936 per PASS in the eROSITA-DE part of the sky.
| Filter | Galactic dust redenning, E(B-V) | Gaia-DR1 source density | Galactic column density, NH |
|---|---|---|---|
| g-band | 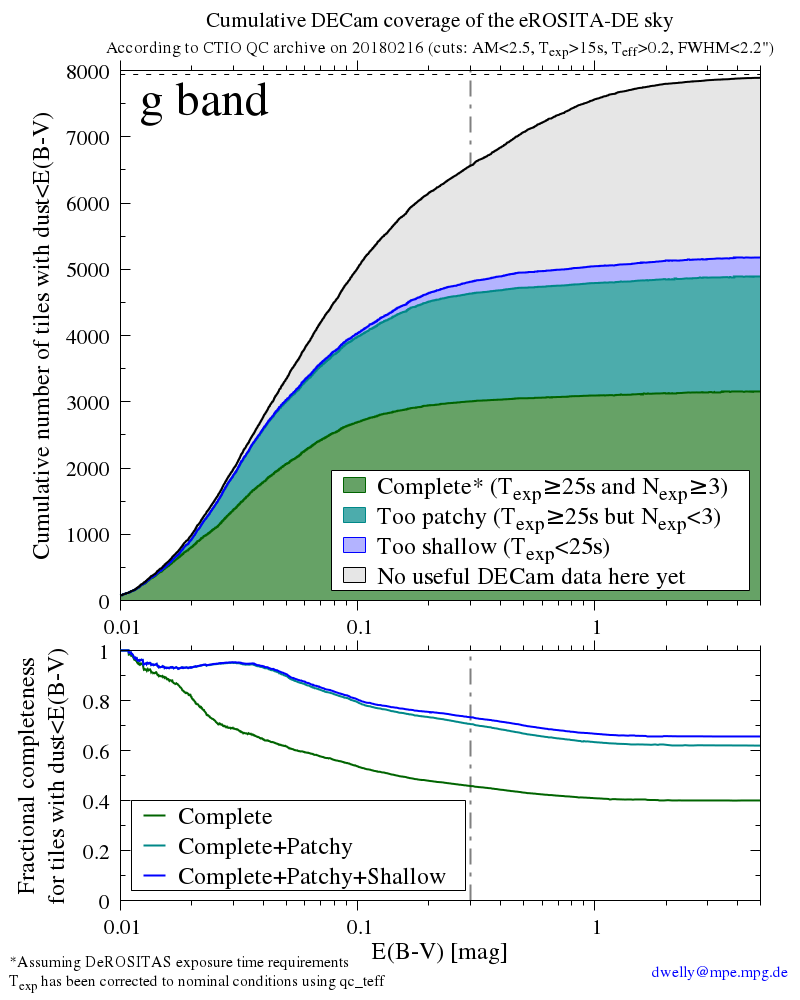 |
 |
 |
| r-band | 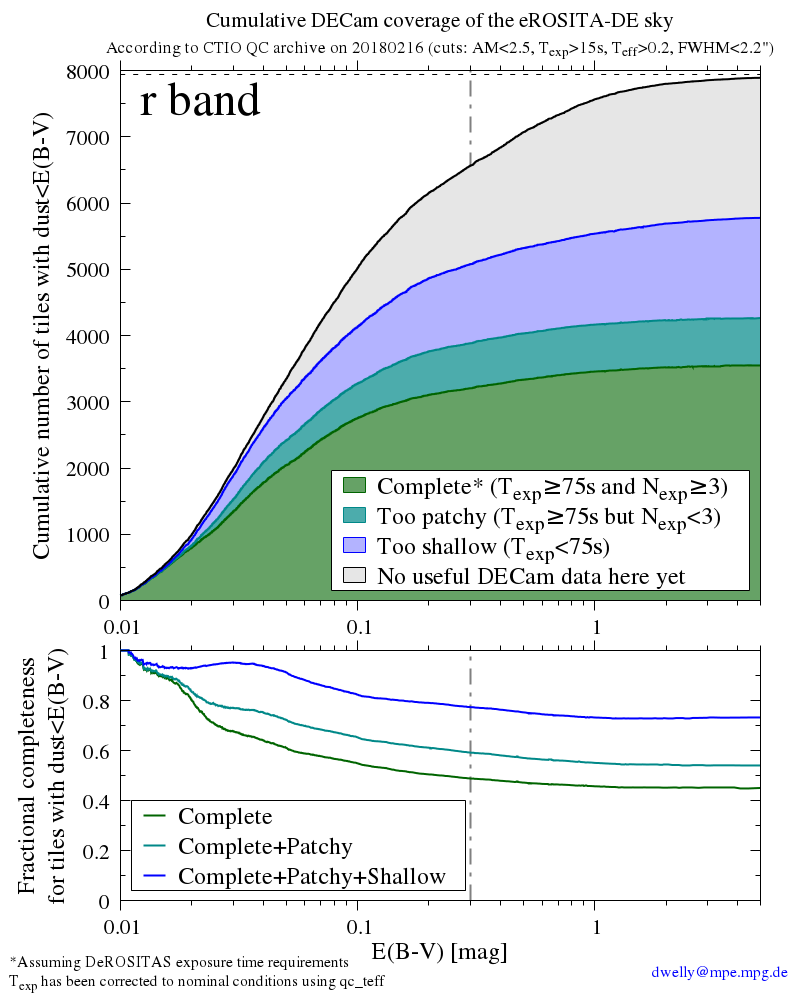 |
 |
 |
| i-band | 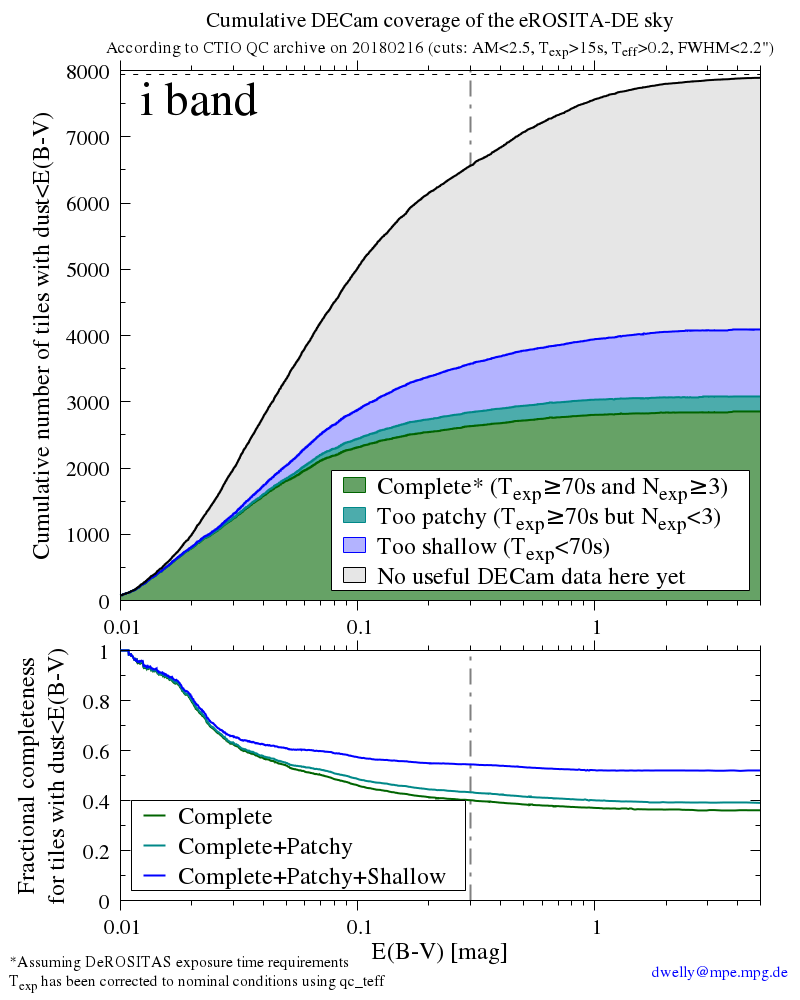 |
 |
 |
| z-band |  |
 |
 |
| Filter | Galactic dust redenning, E(B-V) | Gaia-DR1 source density | Galactic column density, NH |
|---|---|---|---|
| u-band | 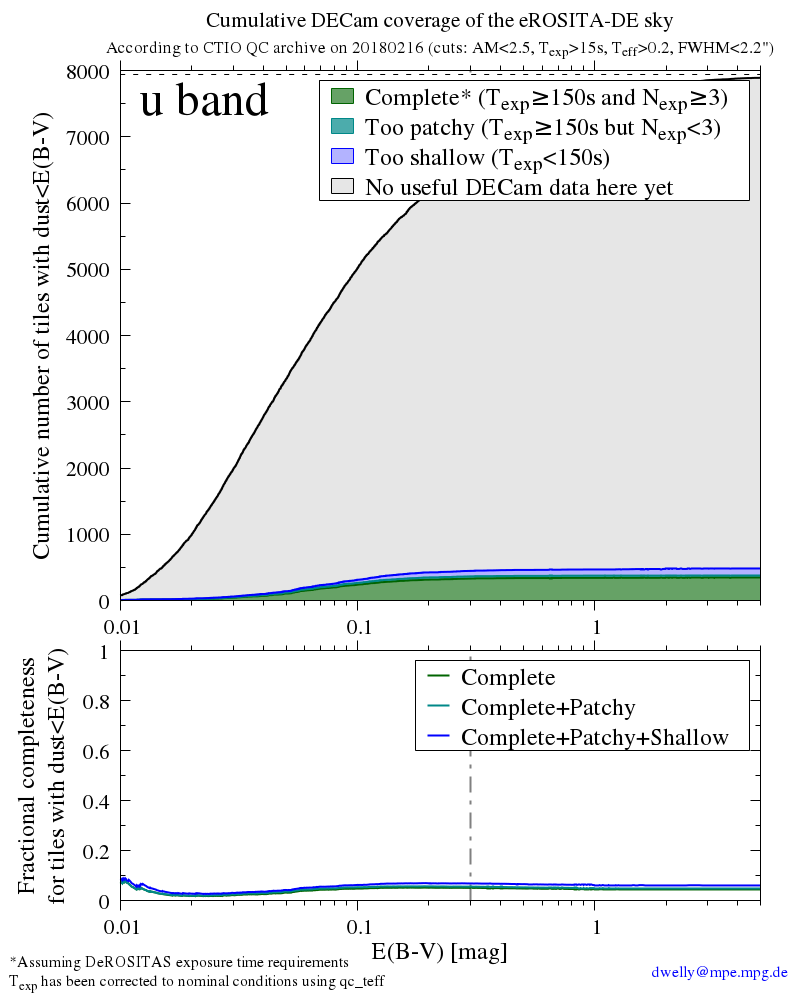 |
 |
 |
| Y-band | 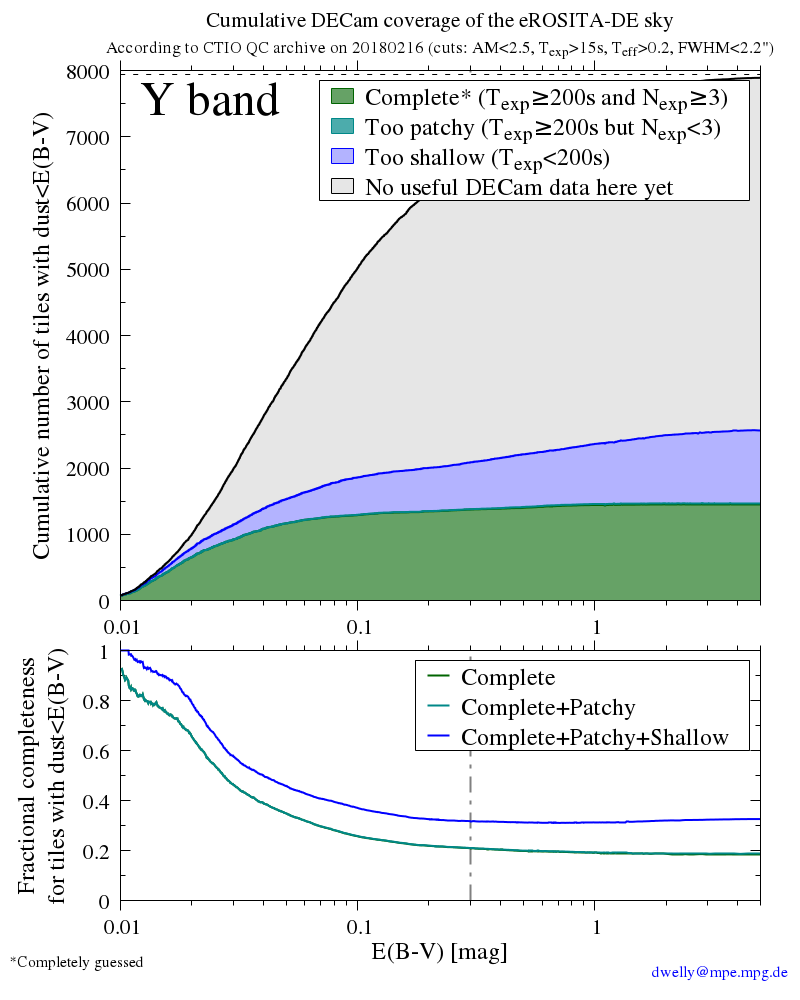 |
 |
 |
| VR-band | 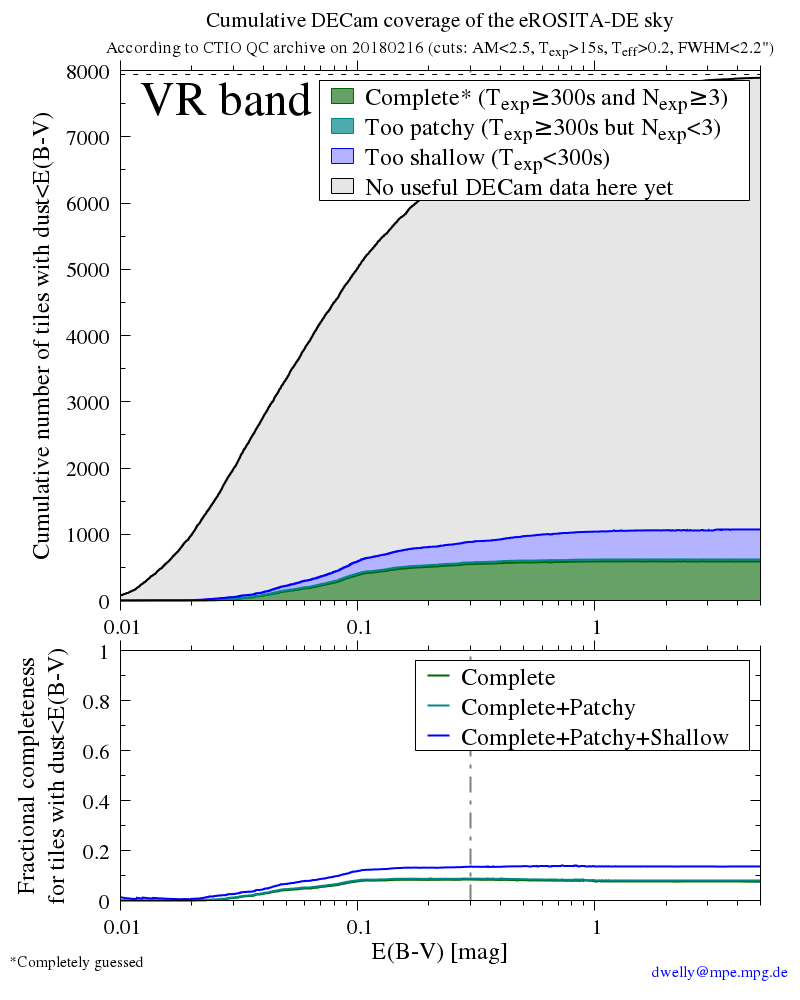 |
 |
 |
| Figure | Description |
|---|---|
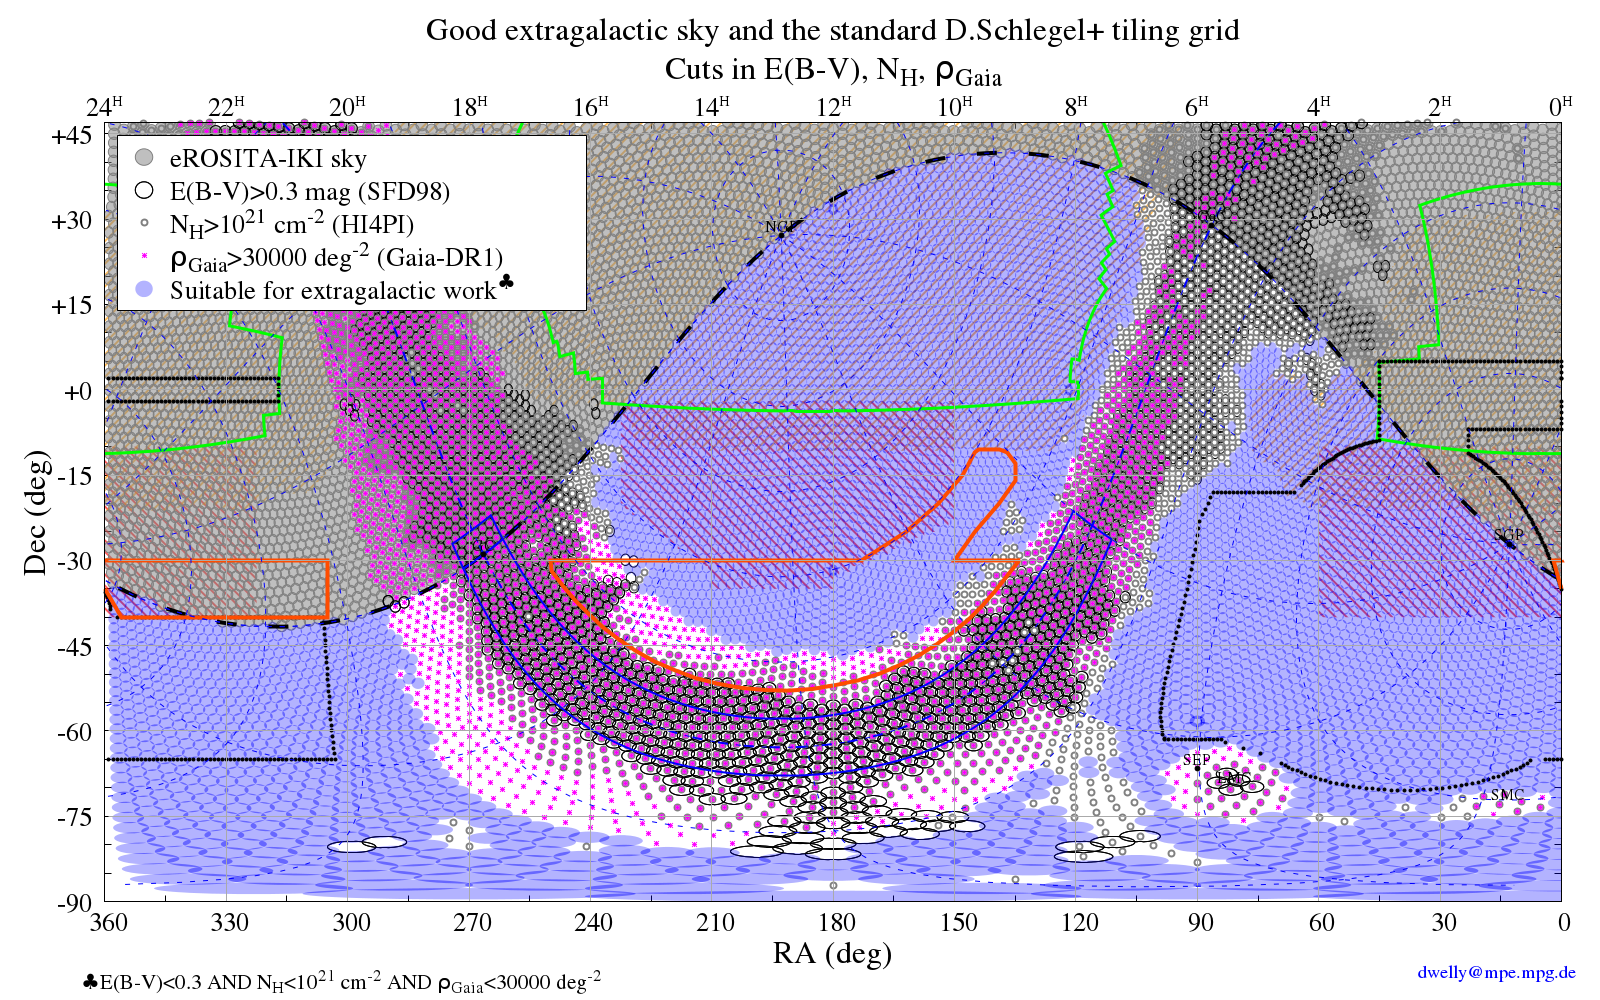 |
What sky is good for extragalactic work? |