
QFitsView cube spectrum plot
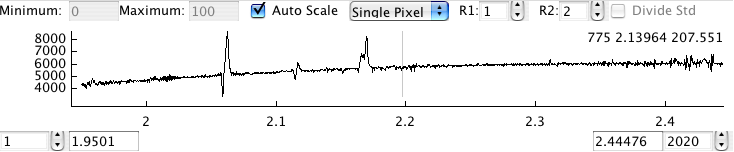
The cube spectrum plot window shows the spectrum along the third dimension
under the current cursor position. When moving the cursor inside the window,
the current channel, wavelength, and spectrum value at the cursor position is
printed at the top right of the spectrum. To stop the continuous update,
either press the "l" key in the main window or select "Lock position" from
the main window popup menu (accessible with the right mouse button).
If you have manually defined pixels for the spectrum generation in the main
window, this spectrum is overplot in green, filled to the bottom of the plot.
Additionally, the plot shows which part of the spectrum is currently used for
the display in the main window:
The light gray vertical marker shows the currently displayed channel in the
main window. Two additional dark gray markers are shown whenever you display
a linemap. The linemap center and the two linemap continuum positions can be
defined inside this window:
- The linemap center is defined by pressing "c" on the keyboard and, while keeping the key pressed, dragging the mouse
- Similarily, the continua can be defined using the "x" and "v" keys. Note that the continuum positions are stored relative to the linemap center, so redefining the linemap center also moves the continua's absolute position
- To remove any of the former, press and release the respective key without moving the mouse
- the horizontal range of the spectrum:
- The inclusive channels can be entered using the leftmost and rightmost input windows
- If wavelength information is available, the range can also be given using the inputs next to the channel inputs
- dragging within the spectrum with the left mouse button allows to interactively select the range
- a click with the right mouse button opens a menu where you can select to show the full range
- the vertical range of the spectrum:
- when the "Auto Scale" box is checked, the full value range of the visible part of the spectrum (depending on the horizontal range) is shown
- if the "Auto Scale" box is not checked, the range can be entered manually using the "Minimum" and "Maximum" entry windows
- The way the spectrum is calculated is controlled with the following four
windows:
- The drop-down box has three modes: Single pixel, Circular, Circular-Annular.
- Single Pixel means the third axis under the current cursor position is plotted
- Circular means the sum spectrum of a circle with radius R1 is calculated
- Circular-Annular means that from the circular spectrum, an annulus mean spectrum with R1<r≤R2 is subtracted
- The "Divide Std" check box is only active if you have previously defined a spectrum to serve as standard star. This can be done in the main windows by chosing the entry in the right-mouse-button menu. If the box is checked, the spectrum is divided by this standard star.
- The drop-down box has three modes: Single pixel, Circular, Circular-Annular.