The Milky Way bar/bulge in proper motions: a 3D view from VIRAC & Gaia
Clarke, J. P., Wegg, C., Gerhard, O., Smith, L. C., Lucas, P. W., Wylie, S. M., 2019, MNRAS, 489, 3519
Recent ground based Infrared surveys have provided an unprecedented view on the bulge of the Milky Way. The Vista Variable in the Via Lactea Survey has recently provided a 300 square degree view of the Galactic bulge over a 5 year observational period. Proper motions derived from this, when combined with the astonishing astrometric properties of the ESA's Gaia satellite, provide an opportunity to study the dynamical structure of the bar like never before.
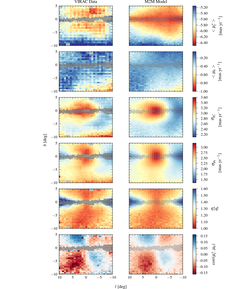
We have used these gaia corrected proper motions to construct maps of the kinematic moments integrated along the line of sight (see figure) and as a function of magnitude. When considering the data as a function of magnitude we use only the Red Clump stars, whose narrow range in absolute magntiude makes them a useful distance proxy, along with some contaminant stars from the Red Giant Branch and Asymptotic Giant Branch Bumps.

We further use the dynamical models of (Portail et al. 2017) to simulate the proper motion signatures we expect for a barred galaxy with a boxy/peanut shaped bulge.
We find a gradient in the mean longitudinal proper motion, <μl * >, between the different sides of the bar, which is sensitive to the bar pattern speed. The split RC has distinct proper motions and is colder than other stars at similar distance. The proper motion correlation map has a quadrupole pattern in all magnitude slices showing no evidence for a separate, more axisymmetric inner bulge component. The line-of-sight integrated kinematic maps show a high central velocity dispersion surrounded by a more asymmetric dispersion profile. σl * /σb is smallest, ~1.1, near the minor axis and reaches ~1.4 near the disc plane. The integrated <μb > pattern signals a superposition of bar rotation and internal streaming motion, with the near part shrinking in latitude and the far part expanding. To understand and interpret these remarkable data, we compare to a made-to-measure barred dynamical model, folding in the VIRAC selection function to construct mock maps. We find that our model of the barred bulge is able to reproduce all observed features impressively well. Dynamical models like this will be key to unlocking the full potential of these data.
