eRASS1 Presskit
Here you can find images and graphics for download for the first eROSITA sky-survey data release (eRASS1).
You are free to use the visuals for your own eROSITA reporting, please give the appropriate credit with each visual.
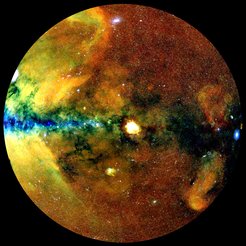
 with the centre of the Milky Way on the left and the galactic plane running horizontally. Photons have been colour-coded according to their energy (red for energies 0.3-0.6 keV, green for 0.6-1 keV, blue for 1-2.3 keV).")

This image show half of the X-ray sky, projected onto a circle (so-called Zenit Equal Area projection) with the centre of the Milky Way on the left and the galactic plane running horizontally. Photons have been colour-coded according to their energy (red for energies 0.3-0.6 keV, green for 0.6-1 keV, blue for 1-2.3 keV).
© MPE, J. Sanders for the eROSITA consortium
Panning through the eROSITA sky
In this animation, you can enjoy the X-ray sky as seen by eROSITA. The X-ray bands have been colour-coded according to their energy (red for 0.3-0.6 keV, green for 0.6-1 keV, blue for 1-2.3 keV) and a number of prominent sources have been highlighted.
First eROSITA sky survey
These images show half of the X-ray sky, projected onto a circle (so-called Zenit Equal Area projection) with the centre of the Milky Way on the left and the galactic plane running horizontally. Photons have been colour-coded according to their energy (red for energies 0.3-0.6 keV, green for 0.6-1 keV, blue for 1-2.3 keV). The three channels are shown separately and in a combined RGB image. In the later two images, a special image processing algorithm is used on the RGB image (a so-called wavelet filtering) to separate extended features from point sources.
. Only 20 million come from individually resolved sources (the eRASS1 catalogue). The majority of the photons detected (approx. 32%) come from the so-called “Cosmic X-ray Background” a uniform, diffuse X-ray glow coming from all directions and produced mostly by the combination of light from distant, unresolved black holes. The second largest component (about 29%) is foreground diffuse emission from the Milky Way hot gas, including the famous “eROSITA Bubbles”. The remaining photons are produced by the solar wind ‘charge exchange’ mechanism, and by the interaction of cosmic rays with the instrument.")
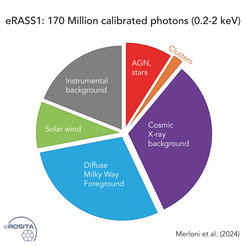
In its first all-sky survey, eROSITA detected 170 million X-ray photons (in its most sensitive energy band with an energy in the range 0.2-2 keV). Only 20 million come from individually resolved sources (the eRASS1 catalogue). The majority of the photons detected (approx. 32%) come from the so-called “Cosmic X-ray Background” a uniform, diffuse X-ray glow coming from all directions and produced mostly by the combination of light from distant, unresolved black holes. The second largest component (about 29%) is foreground diffuse emission from the Milky Way hot gas, including the famous “eROSITA Bubbles”. The remaining photons are produced by the solar wind ‘charge exchange’ mechanism, and by the interaction of cosmic rays with the instrument.
© MPE, eROSITA consortium
 from point sources (right).")

In these two images, a special image processing algorithm is used to separate extended features (left) from point sources (right).
© MPE, J. Sanders for the eROSITA consortium

eRASS1 extended sources
© MPE, J. Sanders for the eROSITA consortium

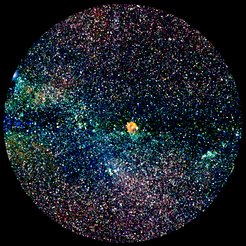
eRASS1 point sources
© MPE, J. Sanders for the eROSITA consortium
")
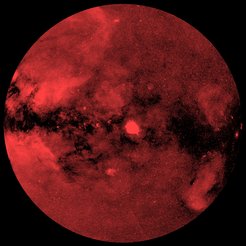
Red channel (soft, 0.3-0.6 keV)
© MPE, J. Sanders for the eROSITA consortium
")
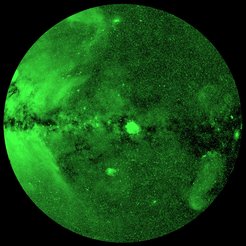
Green channel (medium, 0.6-1.0 keV)
© MPE, J. Sanders for the eROSITA consortium
")
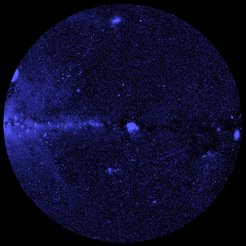
Blue channel (hard, 1.0-2.3 keV)
© MPE, J. Sanders for the eROSITA consortium
, as seen from the Two Micron All Sky Survey, follows the structure of the filament. In the SLOW simulation, which is tailored to reproduce the main features of the Local Universe, this individual system with both clusters and the filament spine is reproduced as well.")

eROSITA X-ray image with the newly discovered filament between two galaxy clusters. The distribution of galaxies (white contours, upper left), as seen from the Two Micron All Sky Survey, follows the structure of the filament. In the SLOW simulation, which is tailored to reproduce the main features of the Local Universe, this individual system with both clusters and the filament spine is reproduced as well.
Dietl et al. (2024)
 to us. The bright white spot at the center is the central galaxy M87 (known for the picture of the supermassive blackhole as observed by the Event Horizon Telescope). The hazy white glow around M87 is the very hot gas between galaxies. It extends out more in some directions than others, and isn’t circular; this is evidence that the Virgo Cluster is still in the process of forming. The colourful stripe in the bottom left comes from foreground emission inside our own galaxy and is known as one of the eROSITA bubbles.")
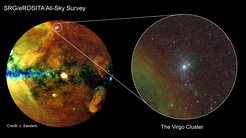
This X-ray image shows the full extent of the Virgo Cluster, which is the closest galaxy cluster (collection of galaxies) to us. The bright white spot at the center is the central galaxy M87 (known for the picture of the supermassive blackhole as observed by the Event Horizon Telescope). The hazy white glow around M87 is the very hot gas between galaxies. It extends out more in some directions than others, and isn’t circular; this is evidence that the Virgo Cluster is still in the process of forming. The colourful stripe in the bottom left comes from foreground emission inside our own galaxy and is known as one of the eROSITA bubbles.
McCall al. (2024)