Results - Flaring Infrared Emission from Sgr A*
Discovery (Genzel et al 2003)
|

The Galactic Center (GC) has been regularly monitored in the infrared ever since high-resolution near-infrared imaging became possible at the beginning of the 1990s. However, in spite of much effort, no unambiguous NIR counterpart of SgrA* was ever detected throughout the 90s and the first few years of the 21st century
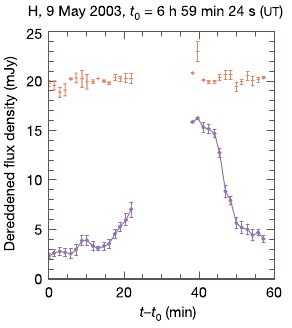
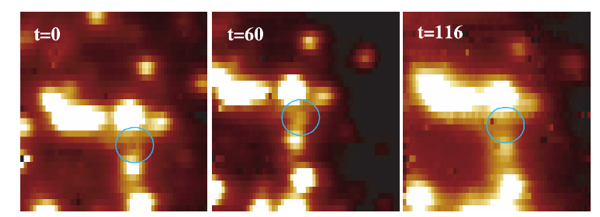
However, from 2003 onwards, all that was to change. On the 9th of May 2003, during routine observations of the GC star cluster at 1.7 microns using NAOS/CONICA at the VLT, we witnessed a powerful flare in real time from the location of the black hole. Within less than 20 minutes, the flux of a faint source in the real time images increased by a factor of 5-6 and faded again after about 30 min. The flaring source originated from within a few milli-arcseconds of the position of SgrA*.
The short rise-and-decay times of the flare told us that the source was smaller than a size of 10 Schwarzschild radii. During subsequent observations in 2003 and 2004, we observed more flares from Sgr A* in the H, K and L-bands (1.7, 2.2 and 3.8 microns) and also what looked like quiescent, polarized, emission from a source at this location. With hindsight, we could also detect a flaring source in older, longer wavelength data from 2002. The variability of an infrared source at the position of Sgr A* was also confirmed in an independent study by researchers from the University of California, LA from observations with the Keck telescope in June 2003.
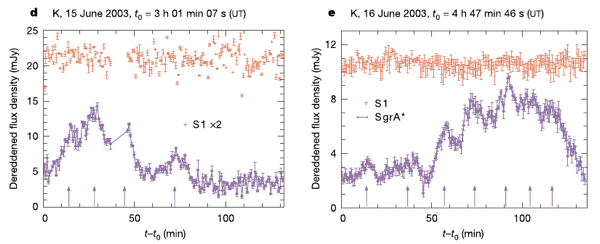
K-band (2.1 micro-meter) flares observed on 15 and 16 June 2003 (Genzel et al 2003).
One of the most striking features of some of the first flares detected from Sgr A* was the presence of substructures, or quasiperiodicities, in the lightcurves at a timescale of roughly 17 minutes. If we interpret this in a model where these substructures are produced due to Doppler boosting of the emission of a hot spot as it orbits close to the last stable orbit of the central black hole, then the orbital period of the spot is so short that we must conclude that the black hole is spinning rapidly (at half the maximum spin possible for a black hole of Sgr A*'s mass).
Further Flare Research Results
Since the first detections of flaring emission from Sgr A* we have continued to detect and study flaring emission from Sgr A*. Some of our findings include:
Spectral index: Flare spectra using SINFONI (Eisenhauer et al 2005, Gillessen et al 2006)
We observed Sgr A* with the AO-assisted near infrared integral field spectrometer SINFONI in July 2004 and were able to detect and measure a weak flare, providing the first spectrum of a Sgr A* flare ever obtained. We observed a featureless red spectrum, supporting a synchrotron origin for the emission, perhaps from an accelerated power law tail of electrons.
A flare caught with the integral field spectrometer SINFONI giving us the first spectrum of the flaring infrared source ever obtained (Eisenhauer et al 2005).
In 2005, we caught yet another flare with SINFONI. Again, the spectrum was featureless and could be described by a power law. This flare was much brighter and with shorter exposures we were able to study the evolution of the spectral index with flux. We found evidence for a correlation between spectral index and flux: for bright fluxes the spectral index of the flare is blue, while for lower fluxes, the flaring emission becomes redder. The variation of spectral index with flux appears to indicate that transient heating and cooling of the electrons may be important in how the flare is produced.
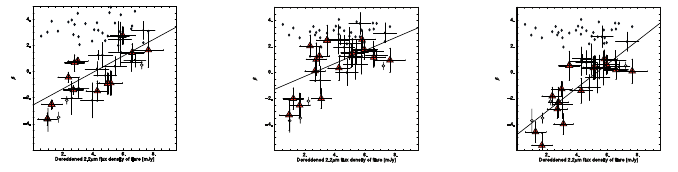
Variation of spectral index with flux (Gillessen et al 2006).
Polarization: Flares are polarized. Also, the polarization increases and the polarization angle swings as the flare fades (Genzel et al 2003, Trippe et al 2007)
Polarization is an important clue to the emission mechanism behind the flares, as a high linear polarization points directly towards synchrotron emission, produced by the spiralling of high energy electrons around magnetic field lines. In 2003 we carried out wire grid polarimetric measurements of the Galactic Center from which we could see that the "quiescent" infrared source at the position of Sgr A* was significantly more polarized than other stars in the vicinity. This was an early indication of a synchrotron emission origin.
In 2007, we obtained high time-resolution of a flare in imaging polarimetry. Not only did we find again that the flare was significantly polarized, but astonishingly, the polarization of the source changed as the flare was fading. As the flare began to subside the polarization of the source increased and there was a simultaneous swing in the polarization angle. This may for example indicate that as the flare fades there is a change in the magnetic field geometry. One credible explanation is that the flaring `spot' itself moved from one magnetic field geometry to another, for example if it left the accretion flow (toroidal magnetic field) and entered a jet (poloidal magnetic field).
QPOs: Flares have obvious substructure on ~20 min timescales (Trippe et al 2007, Hamaus et al 2008)
|
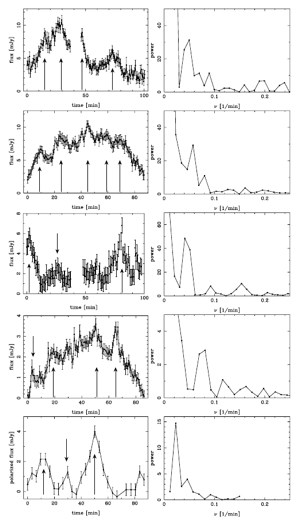
As we continue to observe flares, we also continue to see substructural variations within the flares on typical timescales of ~15-20 minutes. This timescale is too short to be explained mechanisms such as acoustic waves in a thin disk or Lense-Thirring precession. However, 20 minutes is a natural orbital timescale for matter close to the last stable orbit of a black hole of Sgr A*'s mass. In the hot spot model for the flares from Sgr A*, the quasi-periodicities are explained by the Doppler boosting of the hot spot as it orbits Sgr A* on ~20 minute timescales: as the hot spot moves on the part of its orbit that approaches the observer, the emission is Doppler boosted and appears brighter; as it recedes it appears fainter.
In 2008 we successfully modeled our observed flare lightcurves with a hot spot model incorporating general relativistic ray tracing methods. We also investigated the astrometric signal that can be expected for such orbiting spots, and found that they will be within the capabilities of future infrared interferometers (such as the MPE-built instrument GRAVITY). This means with future instruments we may be able to literally watch as hot blobs of gas move near to the precarious last stable orbit of a supermassive black hole!
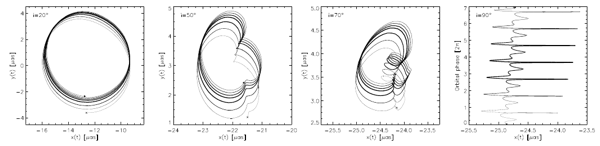
On-sky centroid tracks of the best fit hot spot model to L-band flares from April 4 and July 22 2007 for four different inclinations. Brightness evolution of the flare is indicated by the thickness of the line: the thickest indicates the brightest part of the flare (Hamaus et al 2008).