Flares from the Black Hole
Our group has discovered the (sporadic) infrared emission of Sgr A* (Genzel et al. 2003).


.")

The light curves show excursions that typically last an hour, and often exhibit tantalizing variations on the orbital time scale of the last stable orbit around the massive black hole – 20 to 30 minutes.
During the flares, a small region in the accretion flow appears to heat up electrons much beyond equilibrium, the synchrotron emission of which shines in the near-infrared and even up to the X-ray regime (Dodds-Eden et al. 2009, Ponti et al. 2017, GRAVITY Collaboration 2021).
At an early stage, the energy released in flares suggested that they originated in the inner ~ 10 Schwarzschild radii, but their physical origin remains uncertain. The high amplitudes and short timescales (factors ~ 10 with timescales ~ 30 minutes), nonlinear flux distribution (Dodds-Eden et al. 2011, GRAVITY Collaboration 2020), short timescale changes in the polarization (Trippe et al. 2007), and possible quasi-periodicities in bright flares (Genzel et al. 2003, Hamaus et al. 2009) imply a compact region responsible for accelerating electrons and emitting the observed synchrotron radiation.
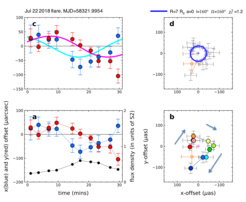
Observations during the summer of 2018 with the new GRAVITY instrument explicitly revealed that indeed the emission during flares comes from the innermost region of the accretion flow. In three instances, flares consistently moved in a clockwise loop only a few times larger than the event horizon of the black hole (GRAVITY Collaboration 2018). These loops are consistent with a small region of heated electrons (a "hotspot"), moving in an orbit around the black hole. Modeling these flares yields constraints on the radius of the emitting region and the angle under which we view the Sgr A* system (GRAVITY Collaboration 2020a). We see the system close to face-on.
. From lower left, the panels show (a) the X and Y positions during the flare (blue and red points, respectively) as well as the light curve (black points), (b) the motion projected onto the plane of the sky, color-coded by the time proceeding from red to blue, (c) the X and Y data along with a model consisting of a hotspot on a relativistic orbit near the black hole, and (d) the astrometric data and model fit on the plane of the sky.")

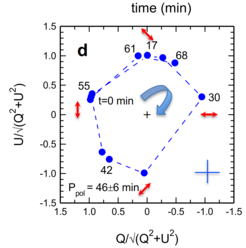
In addition to the astrometric signature of an orbit, GRAVITY observations also revealed changes in the polarization angle over the course of the flare.In particular, as the centroid of the emission region completes one orbit around the black hole, the polarization angle also makes a single loop in the Q-U plane. These polarization measurements indicate the presence of a strong poloidal magnetic field in the immediate vicinity of the black hole (GRAVITY coll. 2020b).
The motion of the centroid of the flare emission moves by only around 100 microarcseconds during half an hour – a tiny angle, yet large enough for us to be able to see this motion using GRAVITY.
Multiwavelength observations of flares confirm that flares are due to synchrotron emission
Sgr A*, the massive black hole at the center of the Milky Way, emits light in a wide range of frequencies of the electromagnetic spectrum. In what is known as the “quiescent state,” most of the flux is emitted at submillimetre wavelengths. However, during flares, the Near-Infrared (NIR) and X-ray fluxes increase by factors of up to 10 and 100, respectively. Studying the properties of this flaring state can help us understand the emission mechanisms at play, the magnetic field structure, and the properties of the accretion flow.
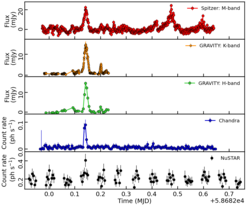
In August 2014, Sgr A* was observed in a bright flaring state at different energies simultaneously: in X-rays with XMM-Newton, hard X-rays with NuSTAR, and in the NIR with SINFONI (Ponti et al. 2017). Even better coverage was achieved in 2019, where Chandra and NuSTAR covered the X-ray bands, Spitzer the long-wavelength NIR part, and GRAVITY the H- and K-band.
, GRAVITY K (orange), and H-band (green), Chandra (blue), and NuSTAR (black) data.")
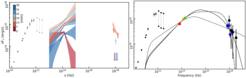
 and different synchrotron models. (lines). The red, solid line shows the favored model, which is based on synchrotron emission from a power-law distribution of electrons with cooling break (in the UV regime), plus an exponential high energy cutoff.")
Far-Infrared Emission from Sgr A*

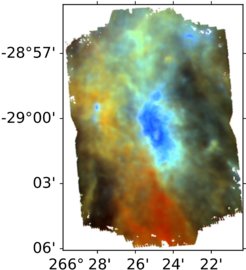
The emission stemming from the immediate surroundings of the Galactic Center Black hole Sgr A* has been observed in many parts of the electromagnetic spectrum. At wavelengths longer than 5 µm the earth's atmosphere is becoming increasingly in-transparent, which makes earth-bound far-infrared observations impossible. For this reason, we use the MPE built camera PACS on board the Herschel space telescope to observe the Galactic Center at 100 and 160 µm in von Fellenberg et al. 2018. Our observations reveal in unprecedented spatial resolution a warm dust structure, which warps around central region of the milkyway, the Circum Nuclear Disk (CND).
However, the bright emission from the CND complicates observations of the black hole: The faint emission from the electrons in the accretion flow of Sgr A* are completely outshone by the CND rendering a direct detection impossible. In order to reveal the black hole, we make use of a trick called differential photometry: The bright thermal emission from the CND is constant, whereas the emission of black hole's accretions flow varies in time. We thus subtract the median images of our observations and correct several artifacts which then reveals the variable flux of the black hole. This allows us to obtain the first upper and lower limits on spectral energy distribution (SED) at 160 and 100 µm.


Comparing the updated SED with the emission from simple one zone models of the accretion flow, we find that solutions with broad peaks better match the modern sub-mm and far infrared observations. Such broad solutions have a higher electron temperature (Te ≈ 1011K) than previously thought and are mostly optically thin at 230 GHz. In contrast to the more pointed older models (e.g. Yuan et al. 2003, Dexter et al. 2010), the peak at 1-3 THz is set by the critical frequency of synchrotron emission and not the transition from optically thin to optically thick synchrotron emission. This sets an interesting stage for the upcoming direct imaging efforts of the EHT collaboration, which aim at resolving the event horizon scale structure of the Galactic Center Black Hole Sgr A*.