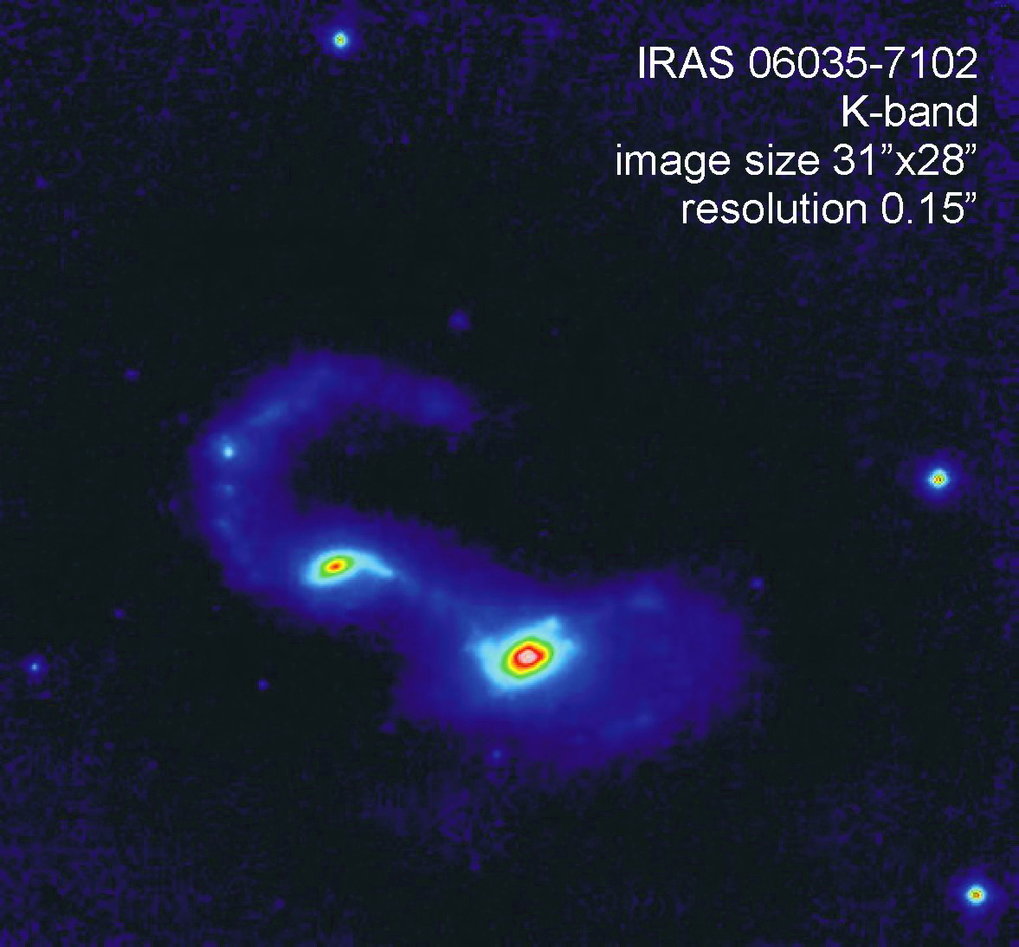
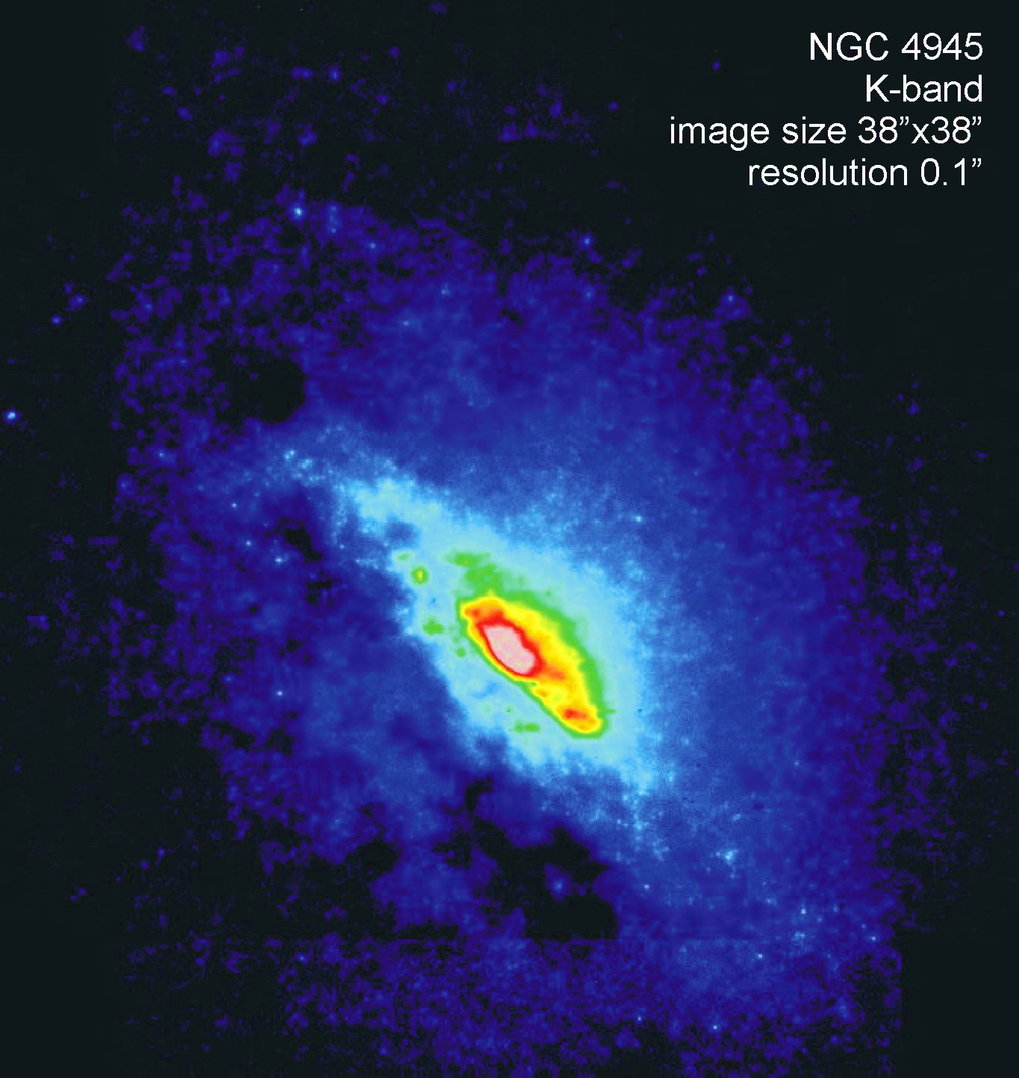
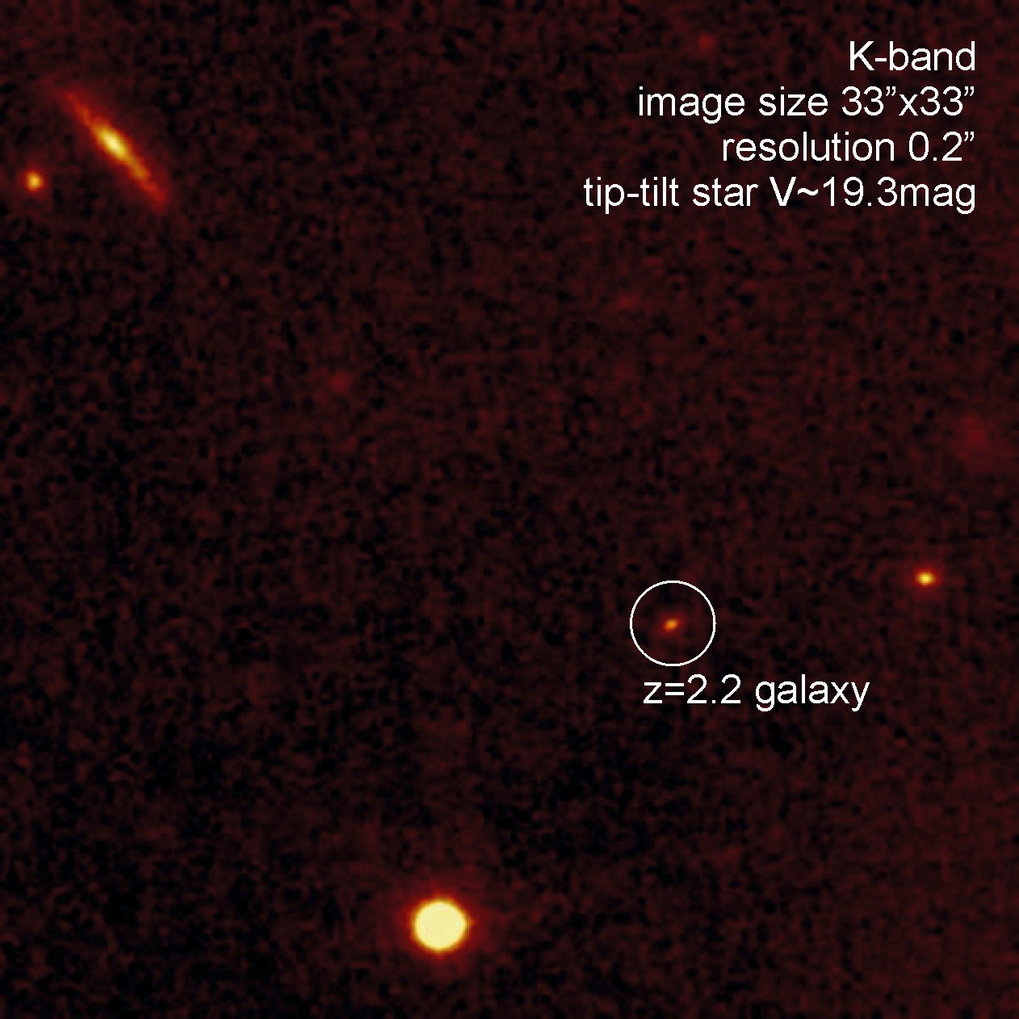
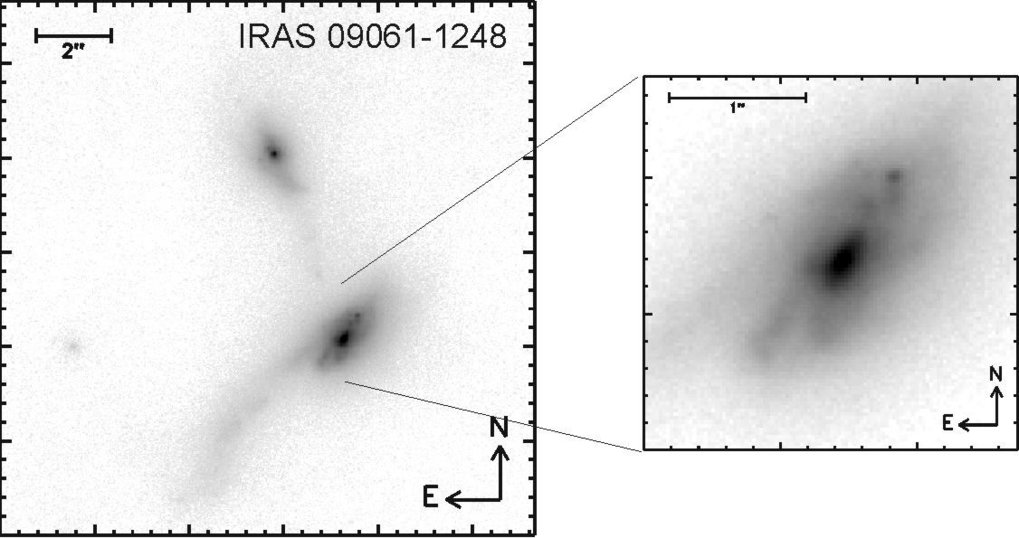
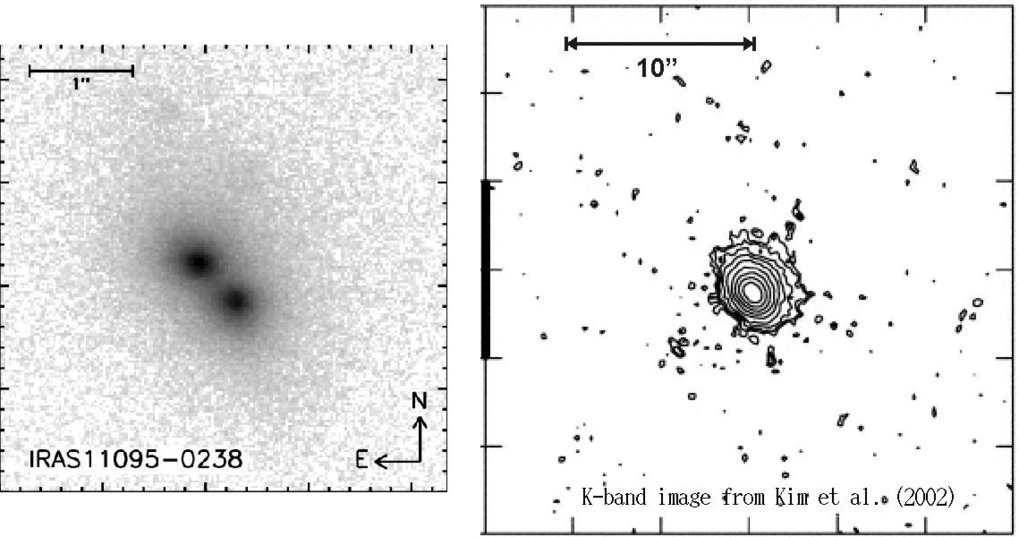
| A few science verification images from the Laser Guide Star Facility: (1) K-band image of newly formed star clusters in the interacting ultraluminous galaxy system IRAS06035-7102; (2) K-band image revelaing countless star clusters, and even individual stars, in the centre of the nearby active galaxy NGC4945, at a resolution of about 2pc; (3) K- and L-band images of the centre of NGC4945, showing that even at L-band there is no single point-like nucleus; (4) deep 1-hour integration (using a very faint tip-tilt star) of a field that includes a star forming galaxy at z=2.2; (5) K-band image of the merging galaxy system IRAS09061-1248 showing details of the structure in one of the progenitor nuclei; (6) K-band image (made without tip-tilt correction) of the merger IRAS11095-0238 clearly resolving the two nuclei which are separated by 0.53", and for comparison a seeing limited image; |
|
|
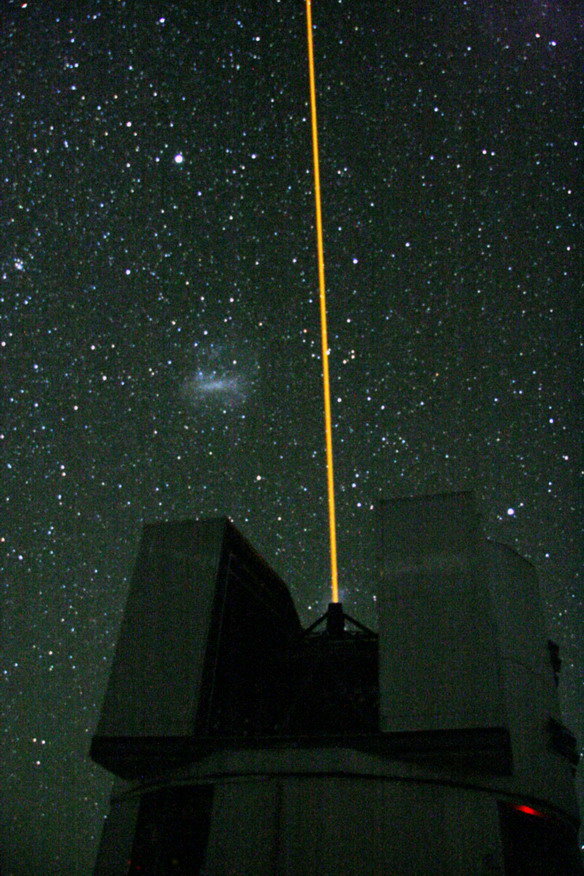
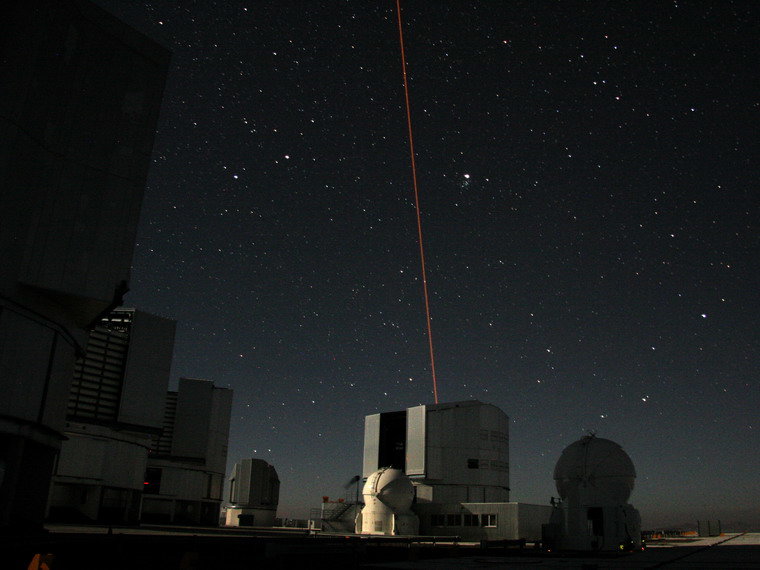
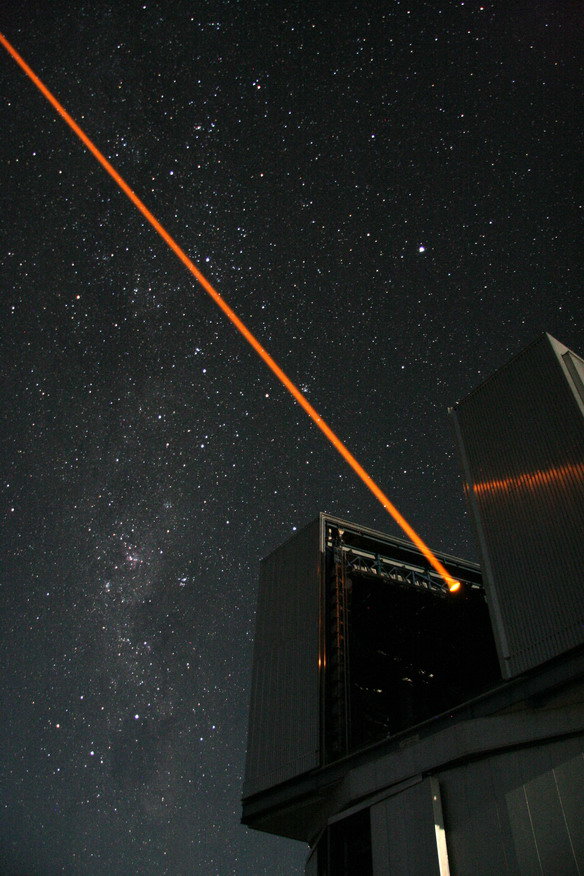
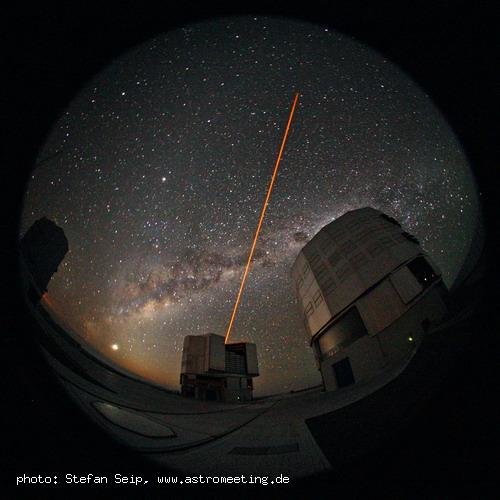
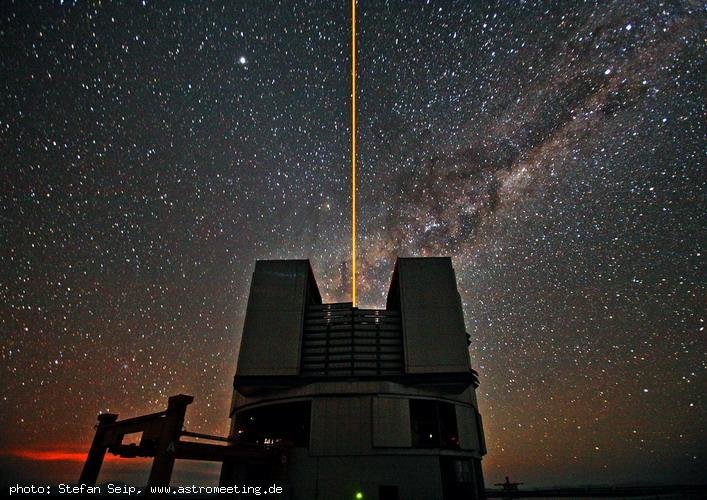
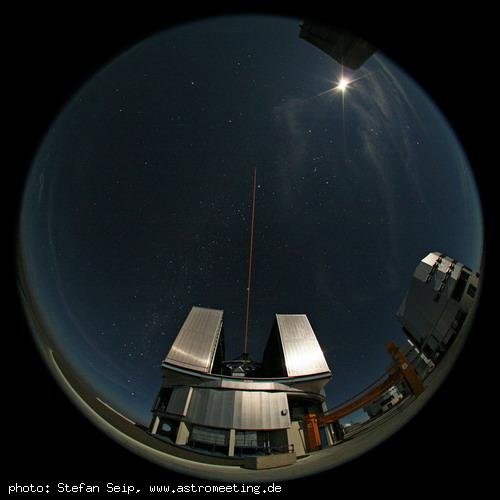
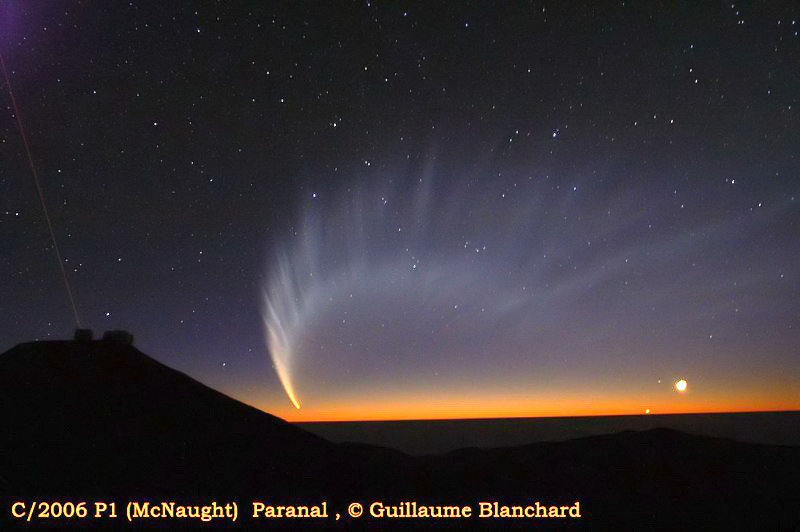
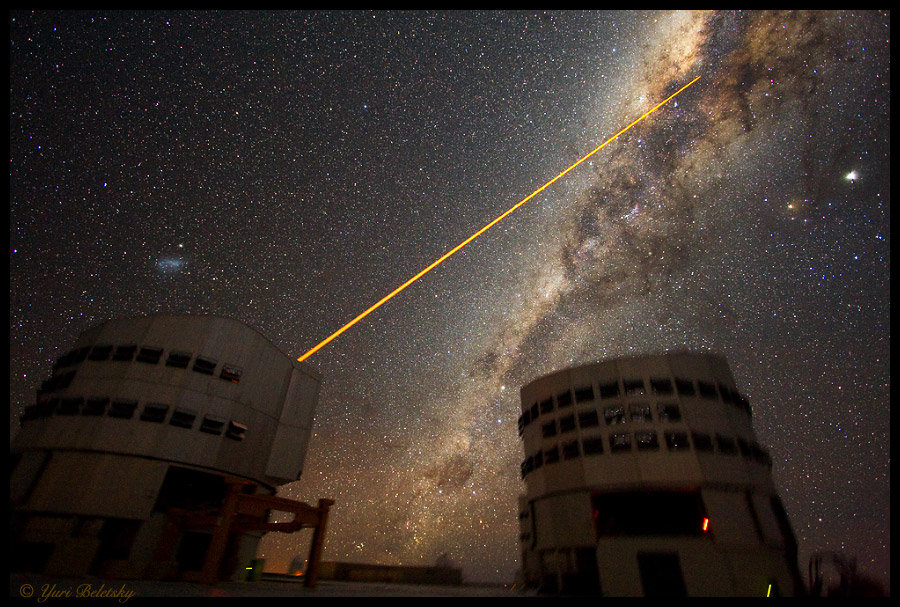
| Images of the PARSEC laser taken during commissioning of PARSEC and the Laser Guide Star Facility, as well as afterwards: (1) first light; (2) the domes lit up by moonlight; (3) reflection of the beam on the dome; (4) fish-eye view with the Milky Way and Venus; (5) view with the Milky Way; (6) view with the Moon and some light cirrus; (7) from inside the dome; (8) comet McNaught shortly after sunset, and the laser (projecting faintly up to the left); (9) pointing the way to the Galactic Center; (10) LGS is spread into a fan while UT4 tracks; (11) the laser beam projectd from UT4. |
|
|
|
|
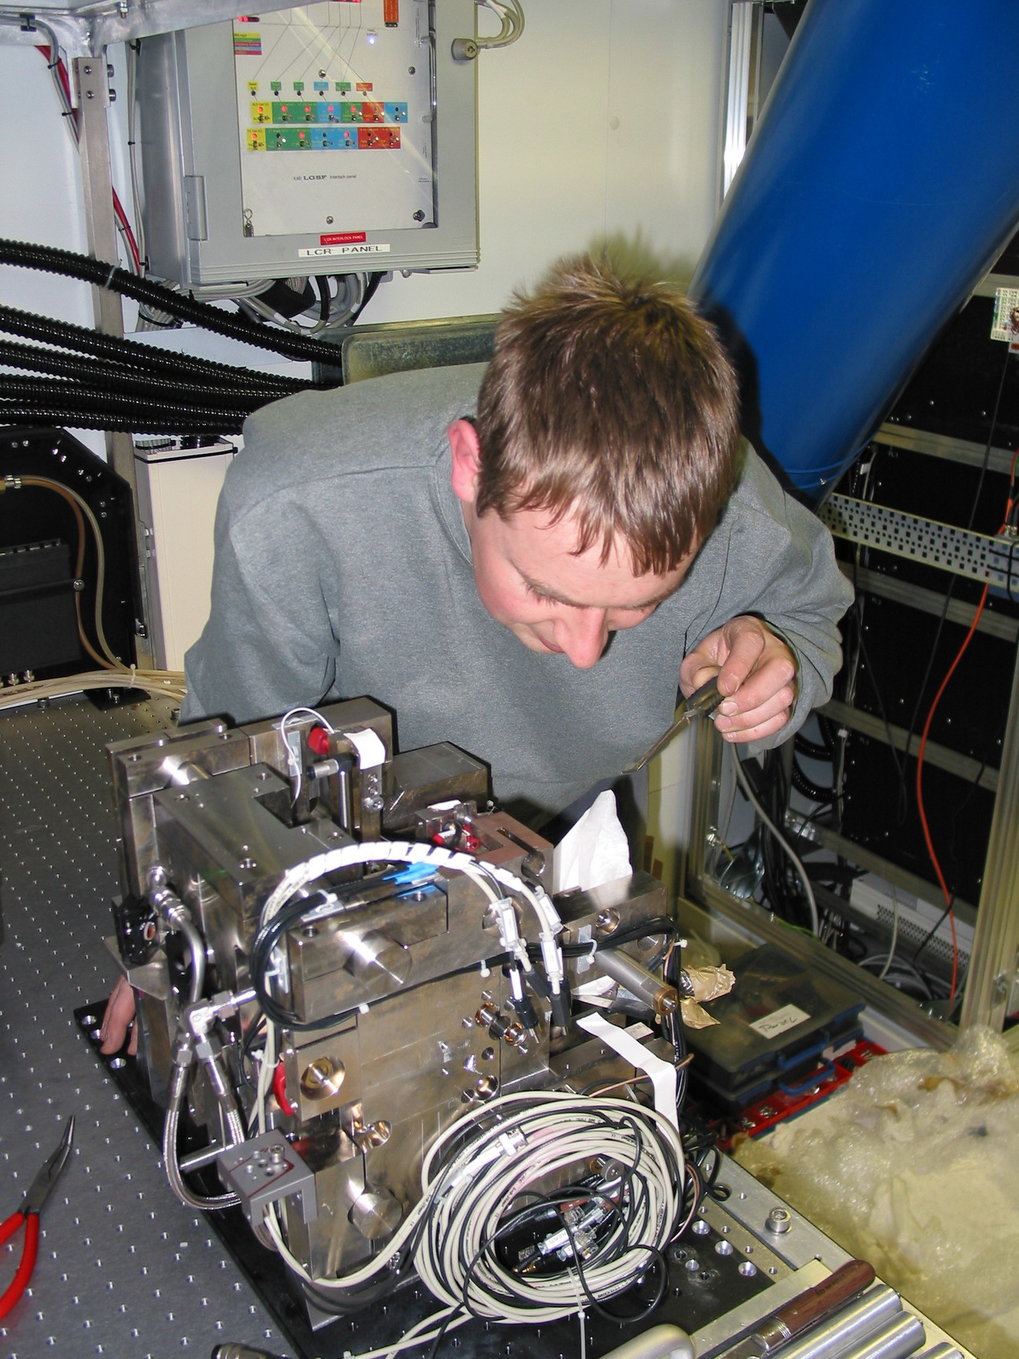
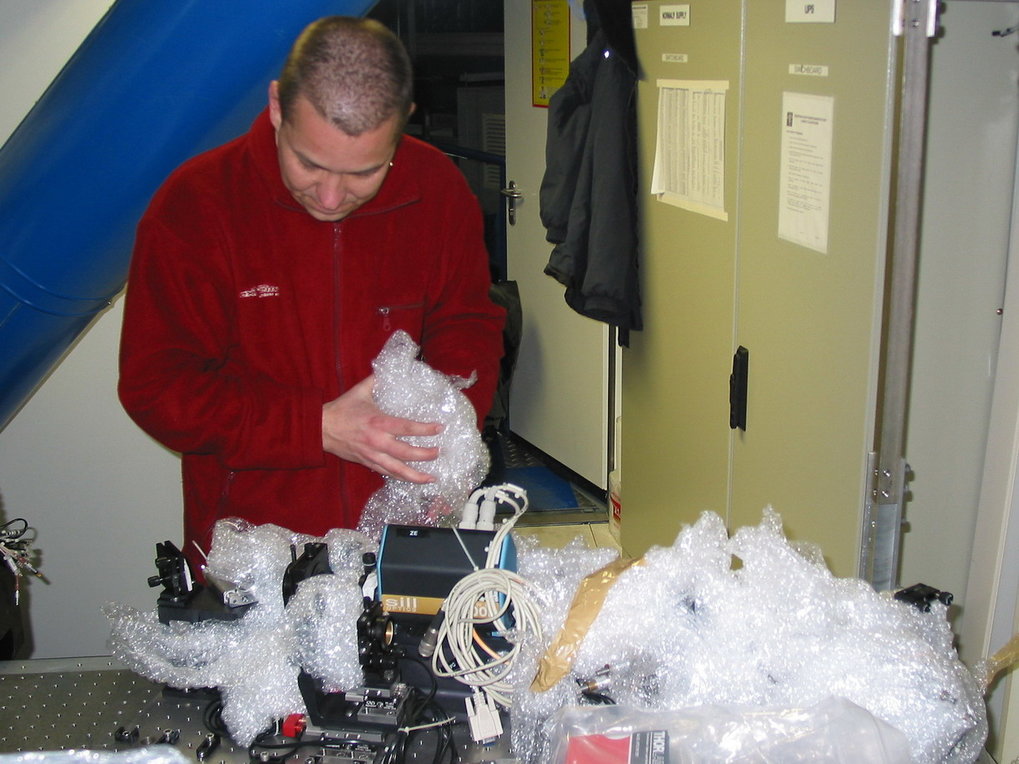
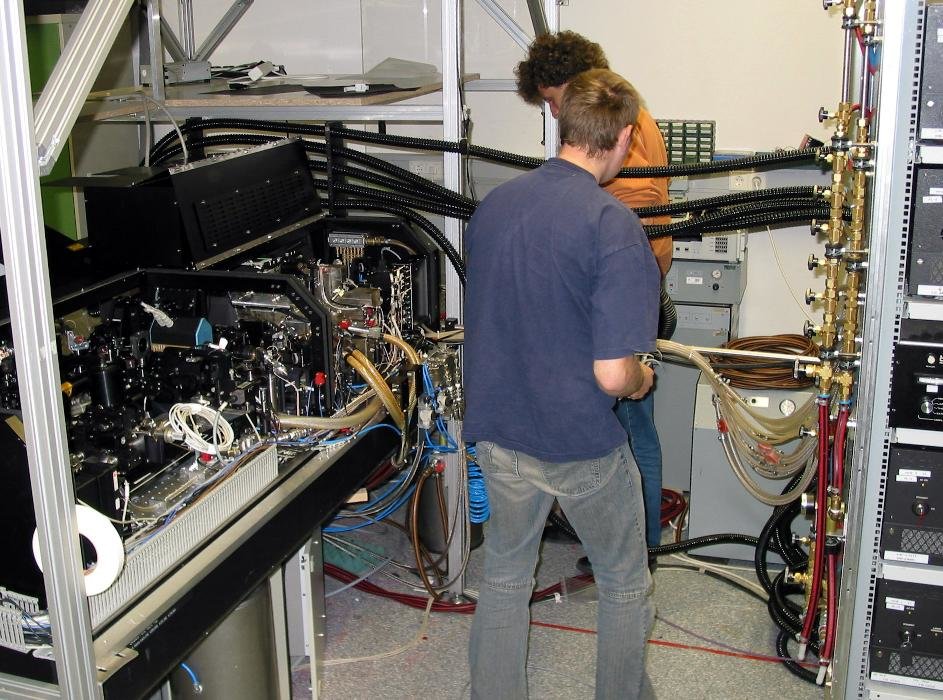
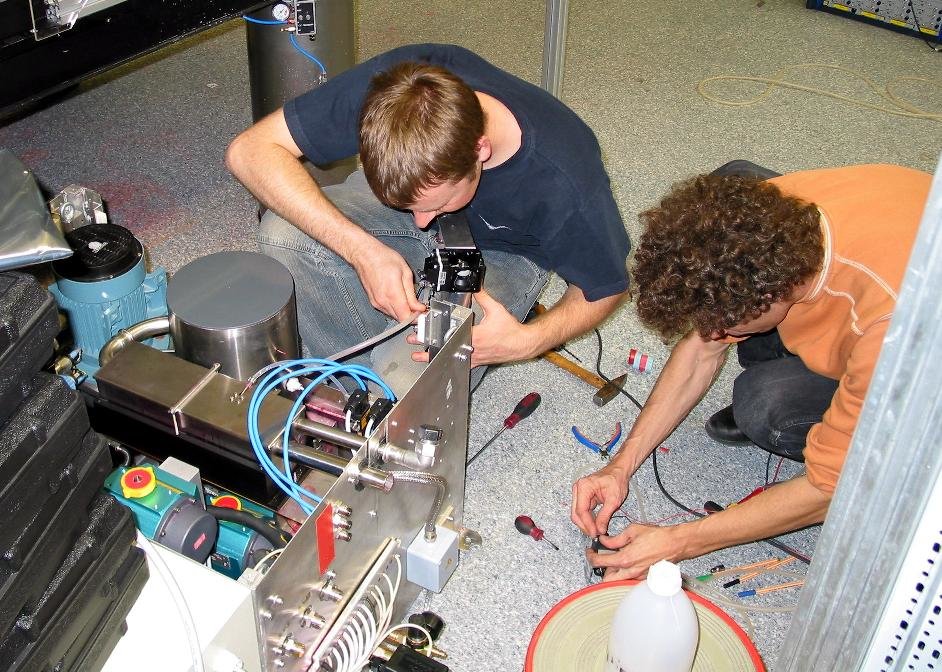
| Installing PARSEC in the laser clean room. (1) Stefan H fixing the cooling; (2) testing the pump lasers at full power; (3) Jose Luis & Ric; (4) Stefan "Señor Ramón de Atacama" preparing cables; (5) Stefan H unpacking the amplifier; (6) Thomas wondering what to do with all the bubble-wrap on the optics baseplate; (7) hoisting the dye circulator into the LCR; (8) the master laser baseplate; (9) Stefan K connecting cables; (10) & (11) Sebastian installing optics and wondering where all the cables are supposed to go; (12) first light for PARSEC in the laser clean room; (13) reaching 13W output power; (14) the view of PARSEC from the door to the LCR; (15) the PARSEC team |
|
|
|
|
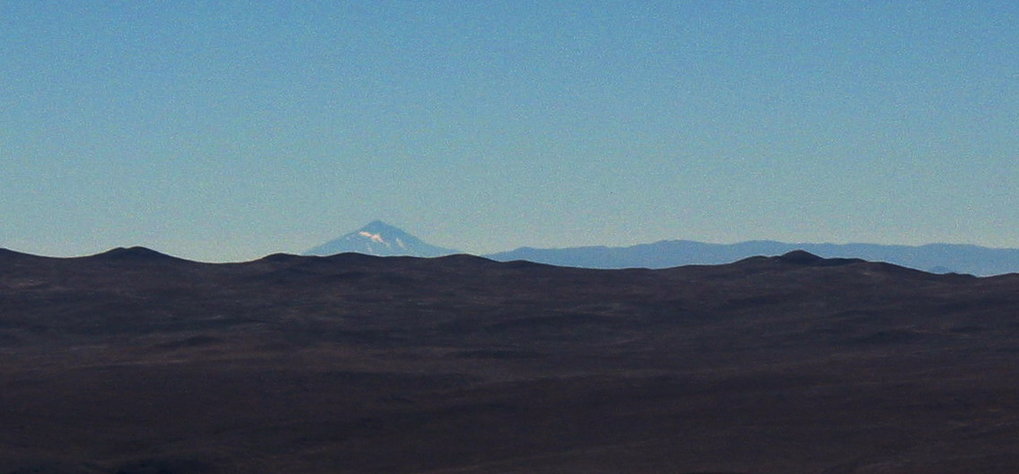
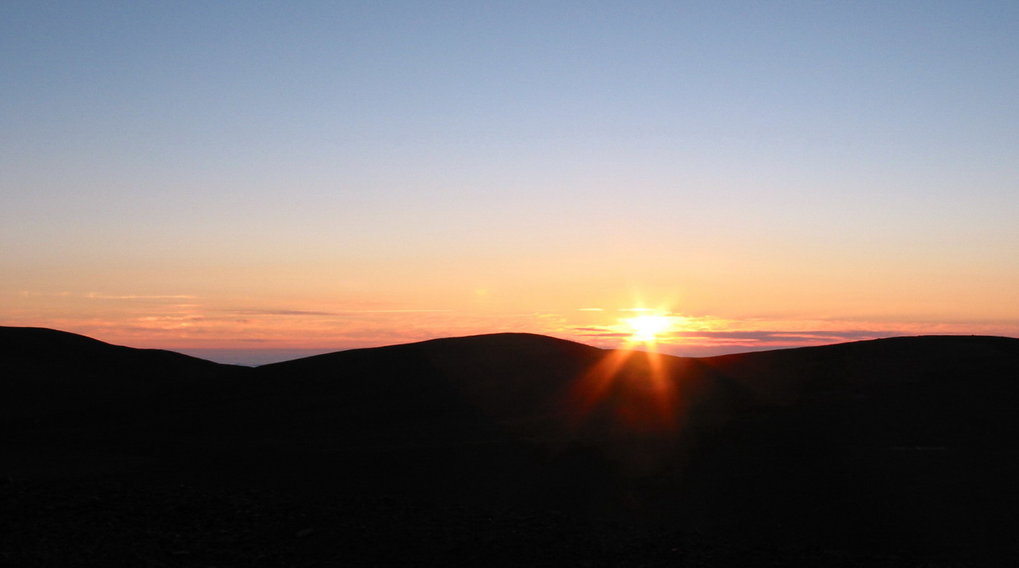
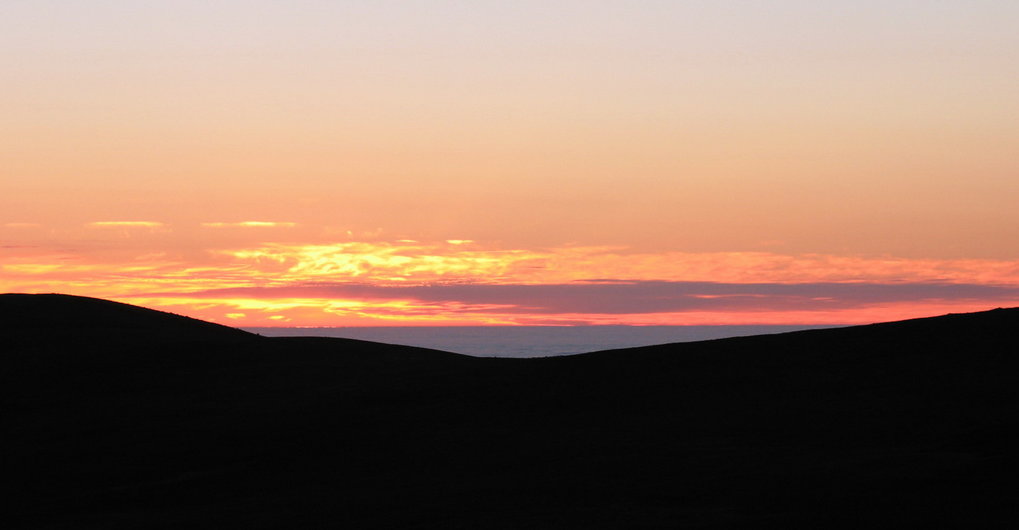
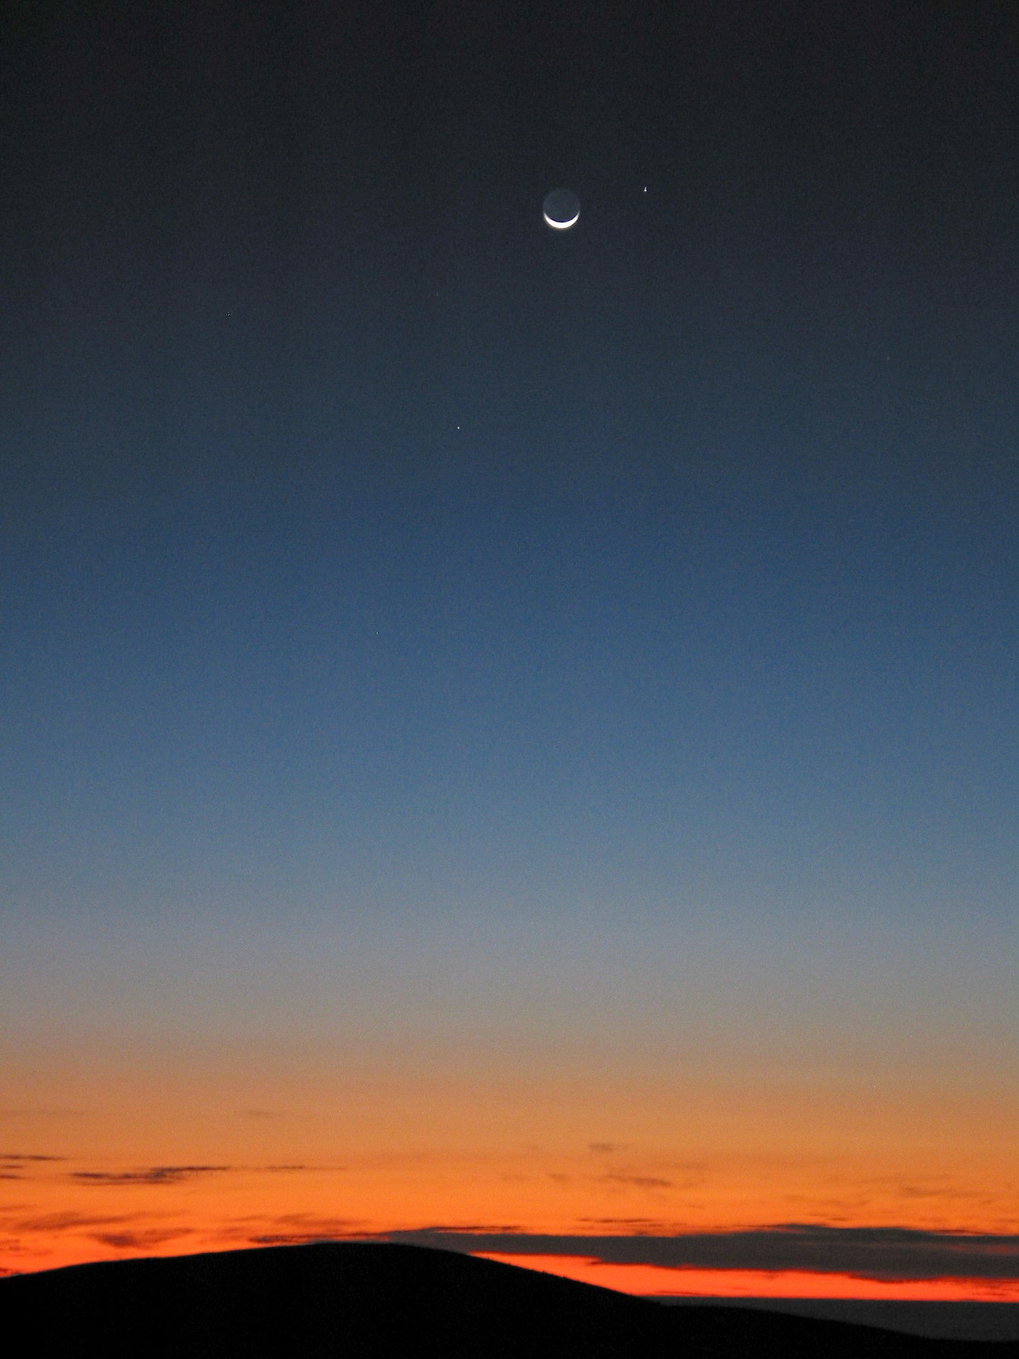
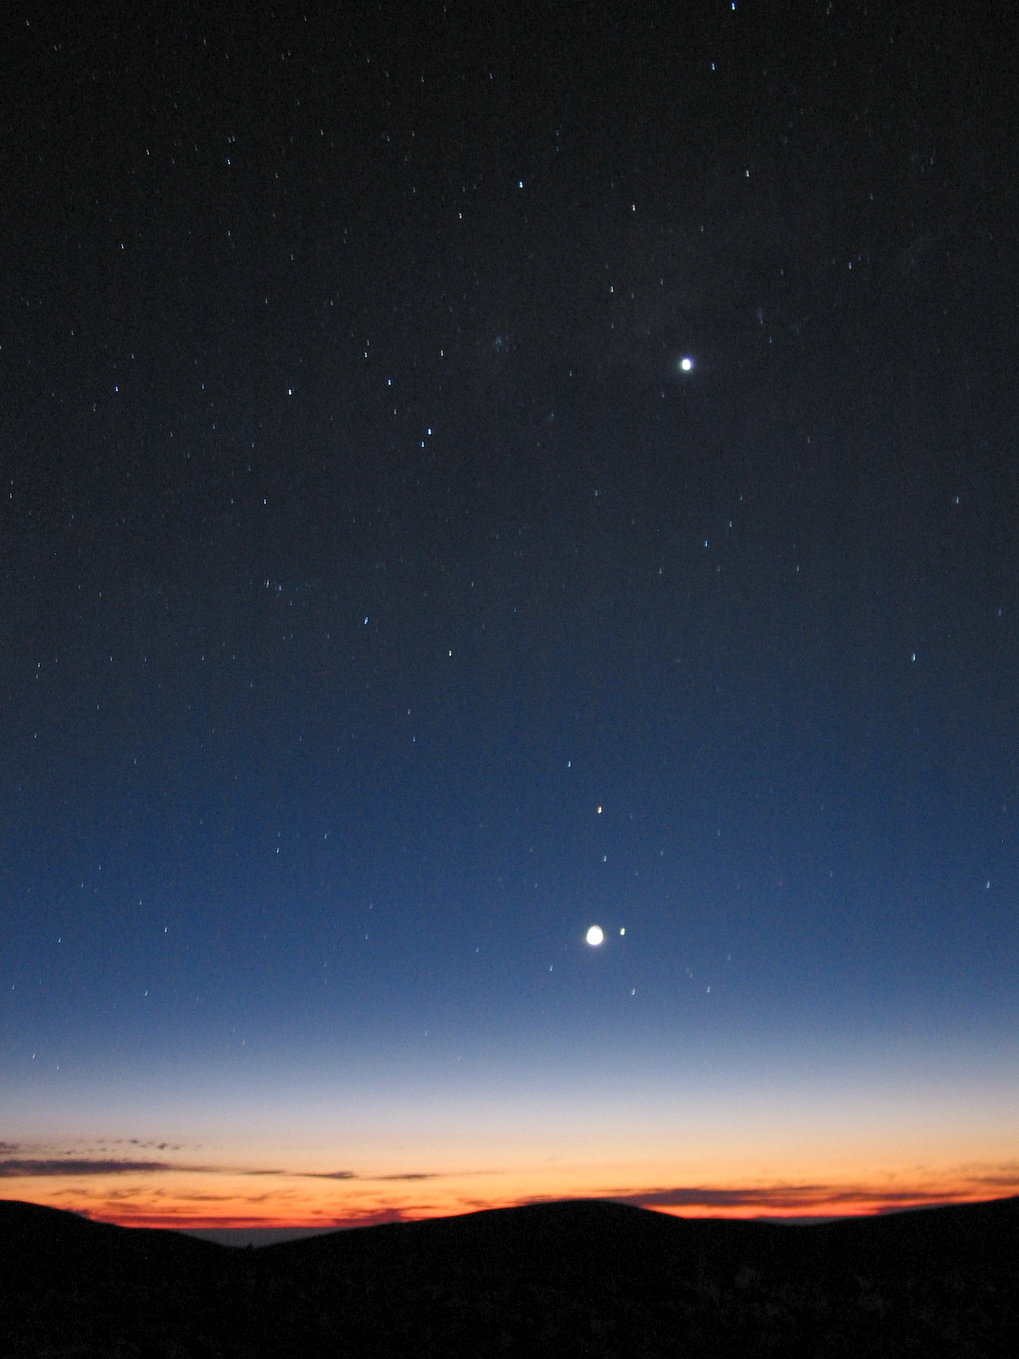
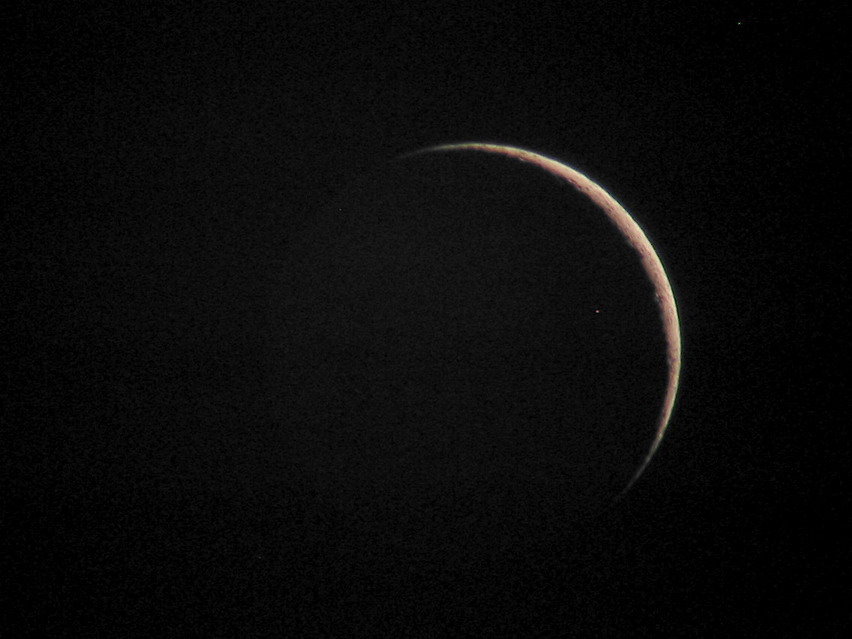
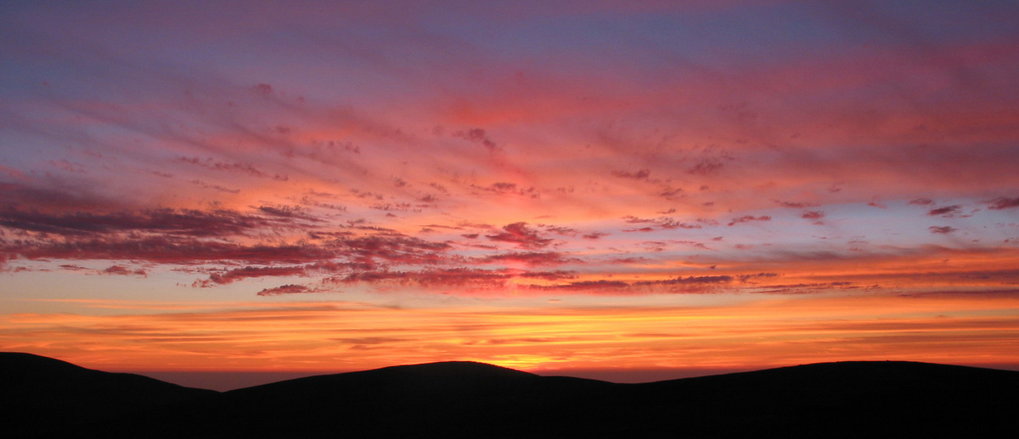
| A few pictures from Paranal. (1) Llullaillaco, a 6740m volcano on the border between Chile & Argentina nearly 200km away; (2) & (3) sunset; (4) Mercury near the Moon; (5) the Moon and Mercury in Scorpius, with Venus above; (6) the new Moon; (7) another rare Paranal sunset |
|
|
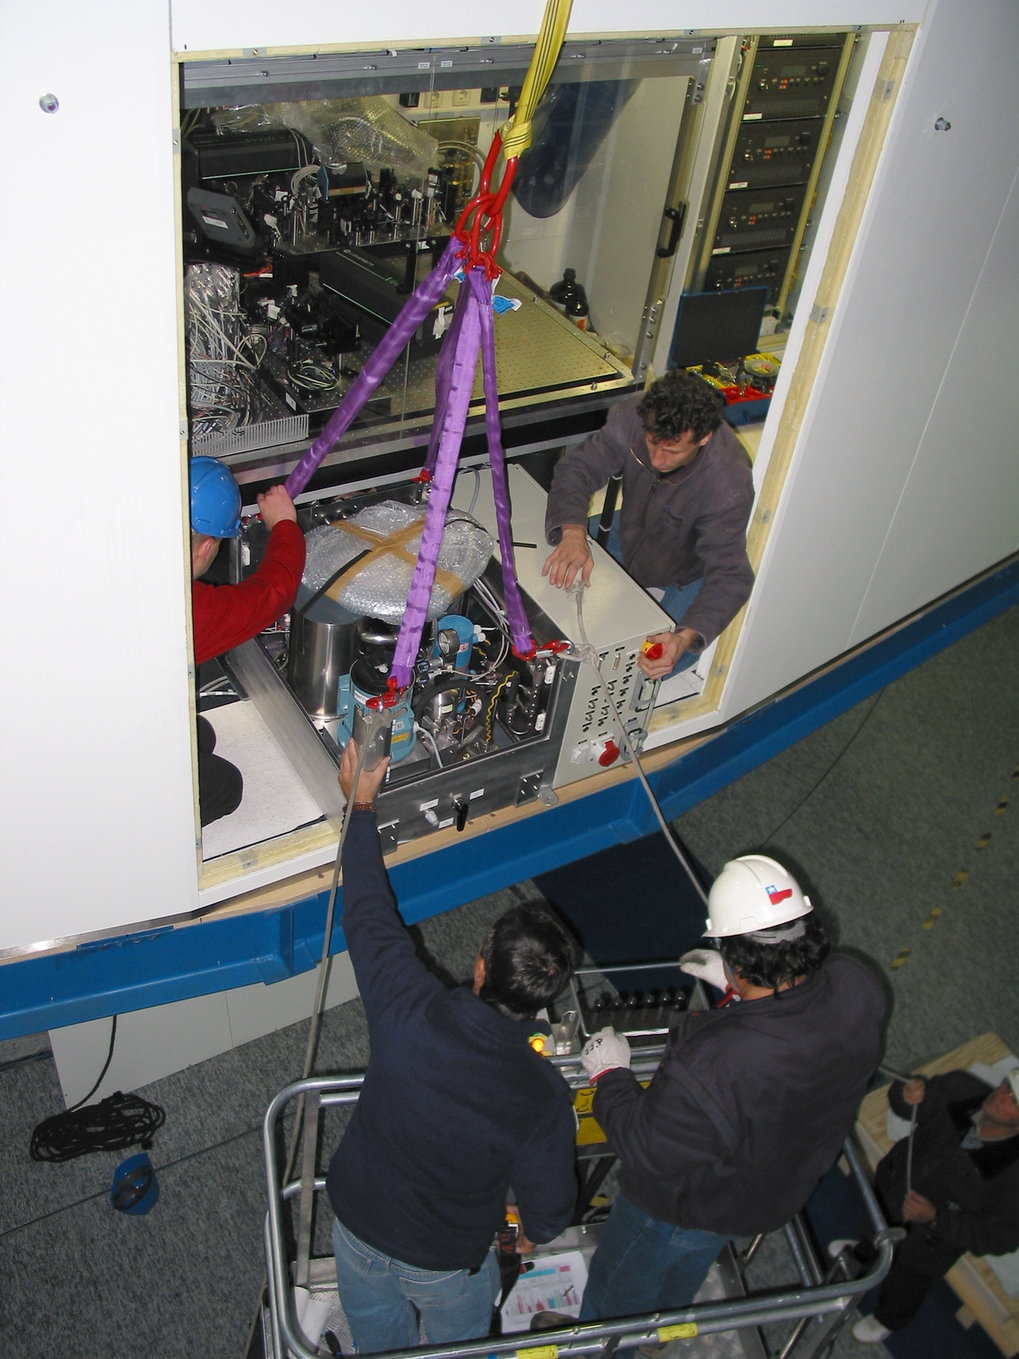
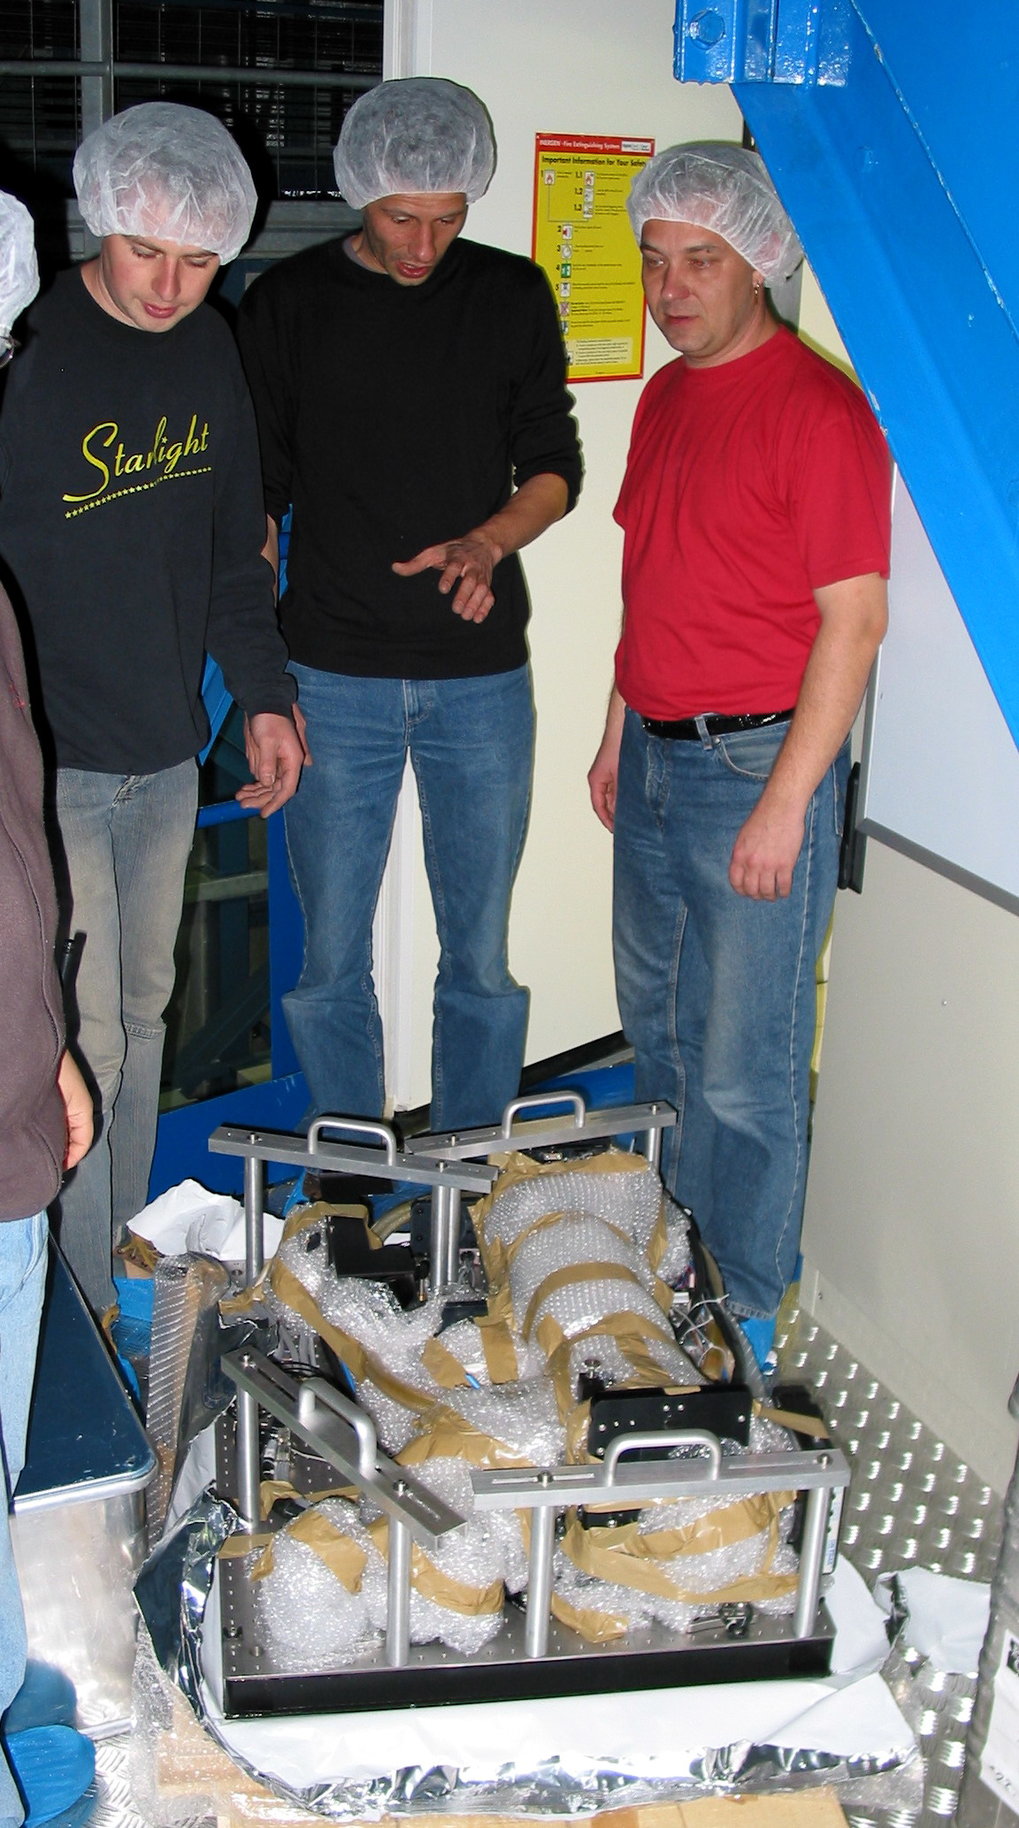
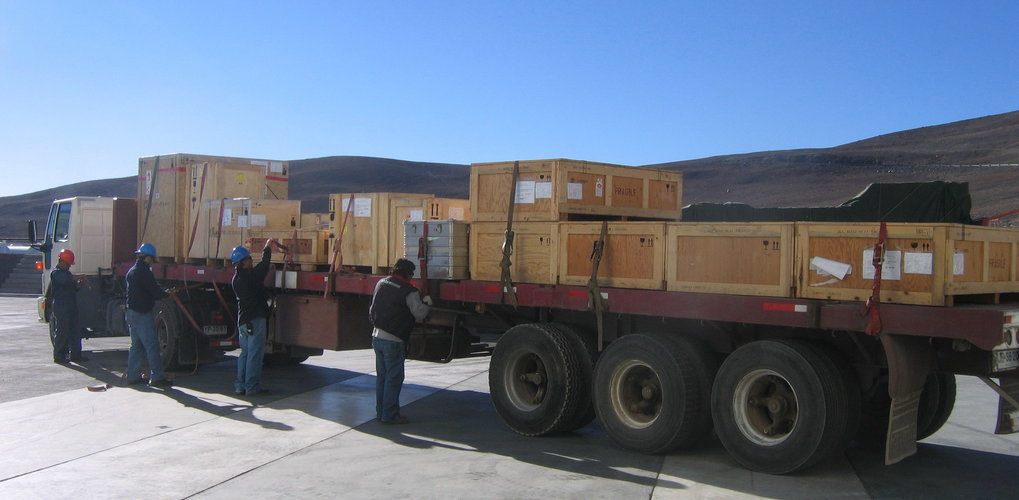
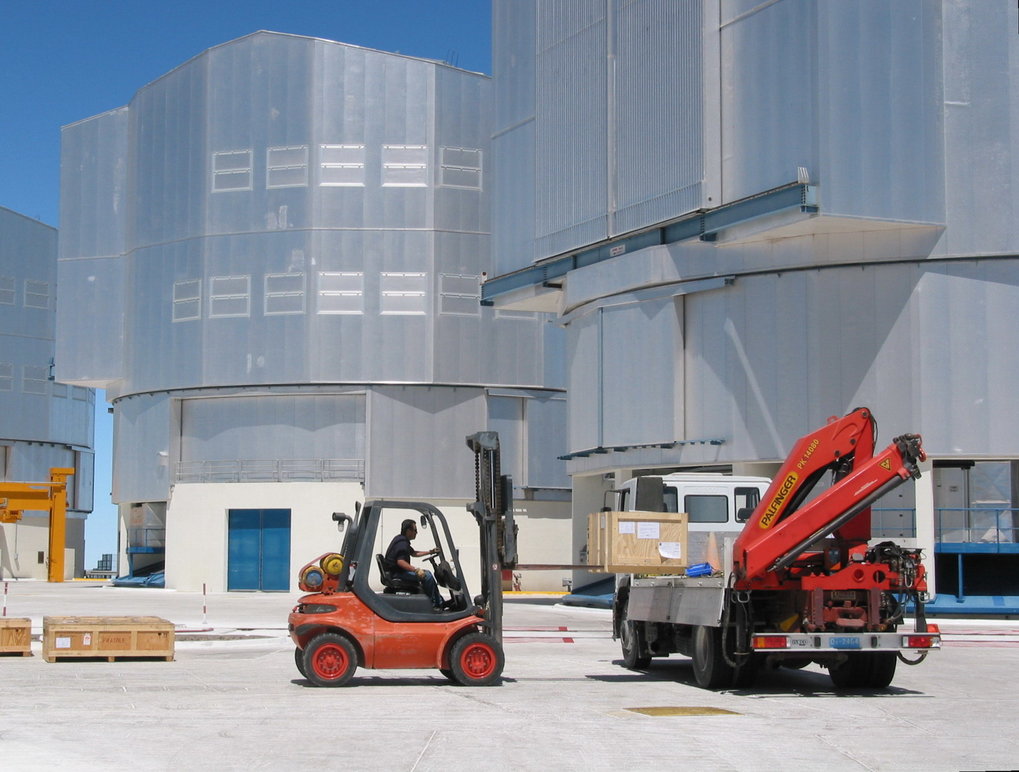
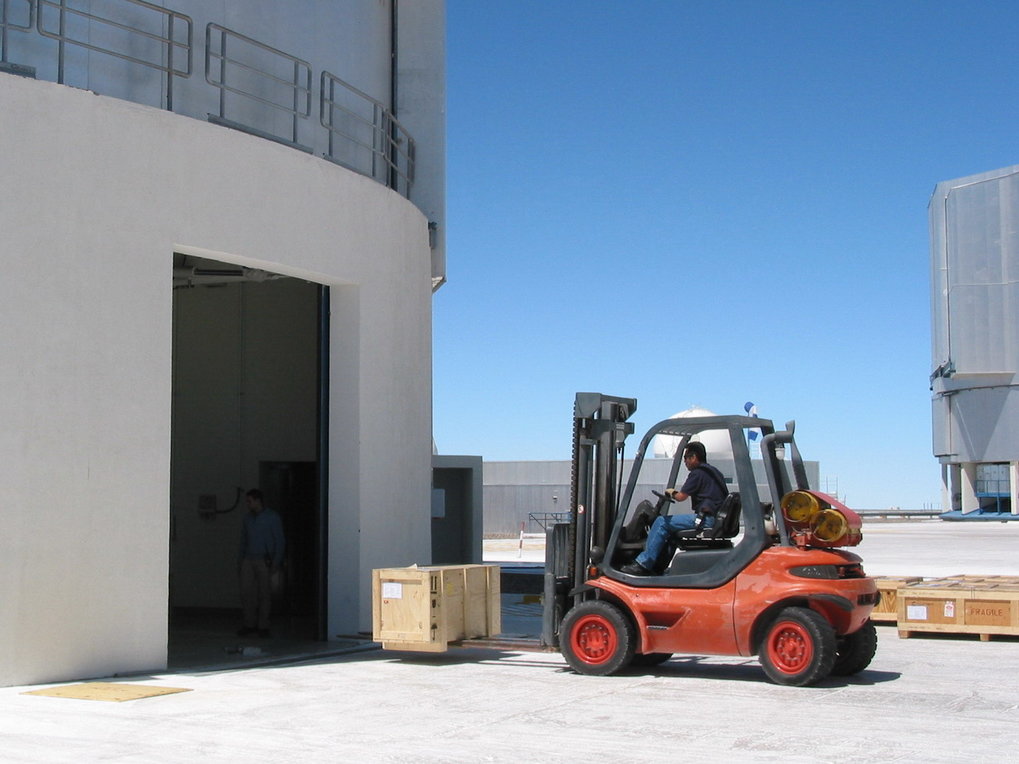
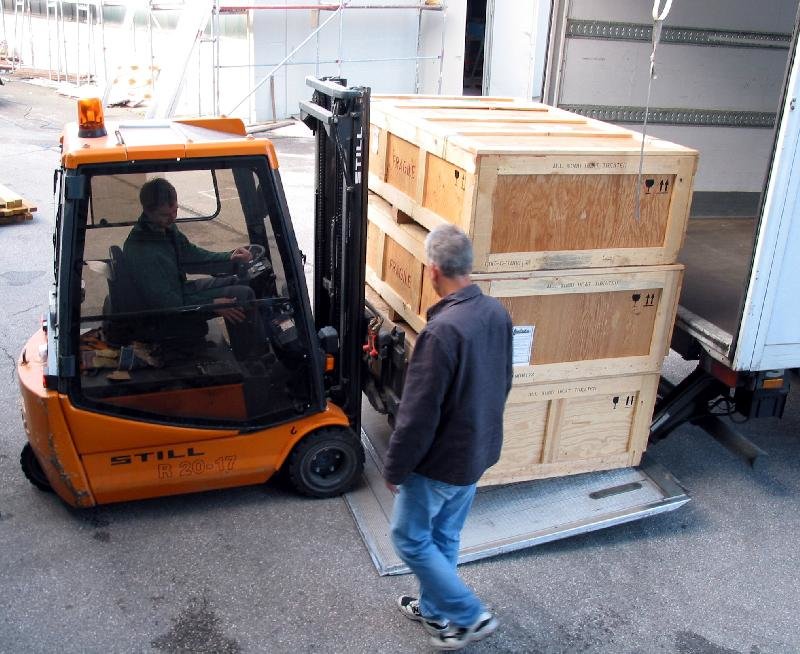
| PARSEC's arrival at Paranal. (1) arrival at the observatory; (2) unloading; (3) finally reaching UT4. |
|
|
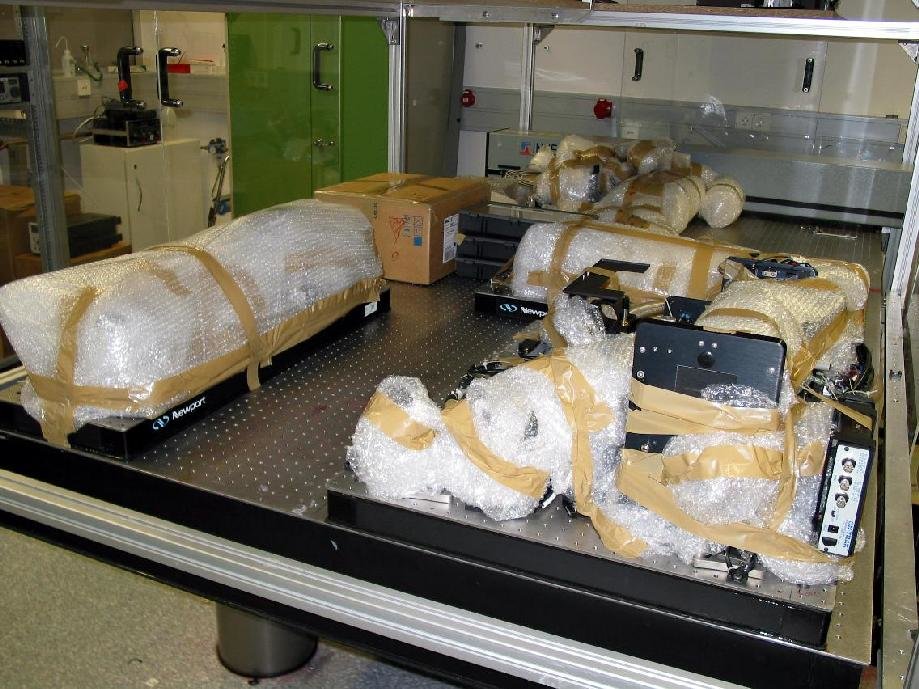
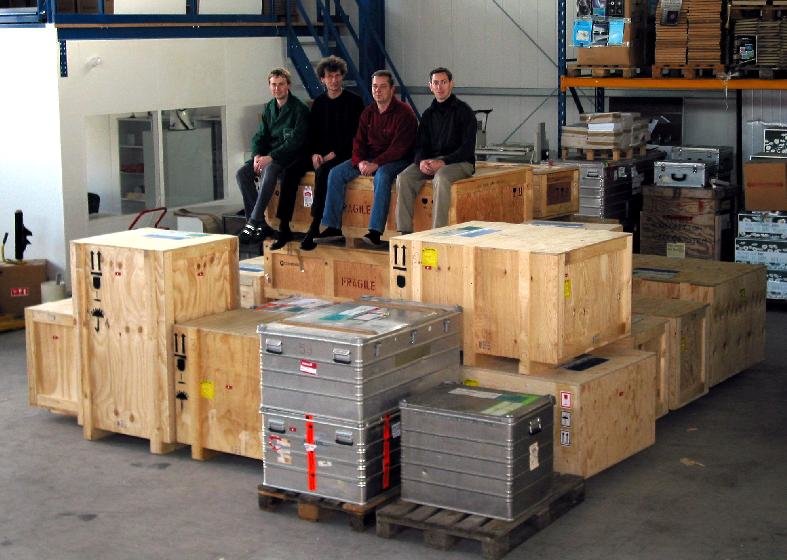
| Packing PARSEC, and producing 2.7 tonnes of freight to fly to Chile. (1) Stefan H & (2) Sebastian preparing for the real work; (3) Stefan K and his cables; (4) the optical table starting to look empty; (5) Stefan H & (6) Sebastian doing last second maintenance on the dye circulator; (7) optics ready to go into boxes; (8) first load into the lorry; (9) all crates together at ESO, with Stefan H, Sebastian, Thomas, & Ric. |
|
|
| PARSEC in its final state, during the long term test in September 2004. During this test, the laser ran for over 72 hours in a 4 day period with an average power of more than 13W and with only occasional remote adjustment. During the last 17 hours, it ran without being touched at all. |
  |
| Graphs showing how the 589nm output power and the conversion efficiency (green 532nm to orange 589nm) increase with 532nm pump power in the amplifier. The effect of adding 30ml of COT (a quencher which reduces the lifetime of the triplet state in the Rh6G dye) to the 8 litres of dye solution is dramatic, and boosts both the conversion efficiency and the output power by nearly 50%. |
|
| Graphs shoing the long term stability of the 589nm outpower power and the mode quality (M2=1 is a perfect diffraction limited beam) over a period of a week, when the laser was being operated during each day. Both the power of 12-14W and the mode quality of M2=1.1 are the typical values that are achieved during normal operation without special tuning or adjustment. |
 |
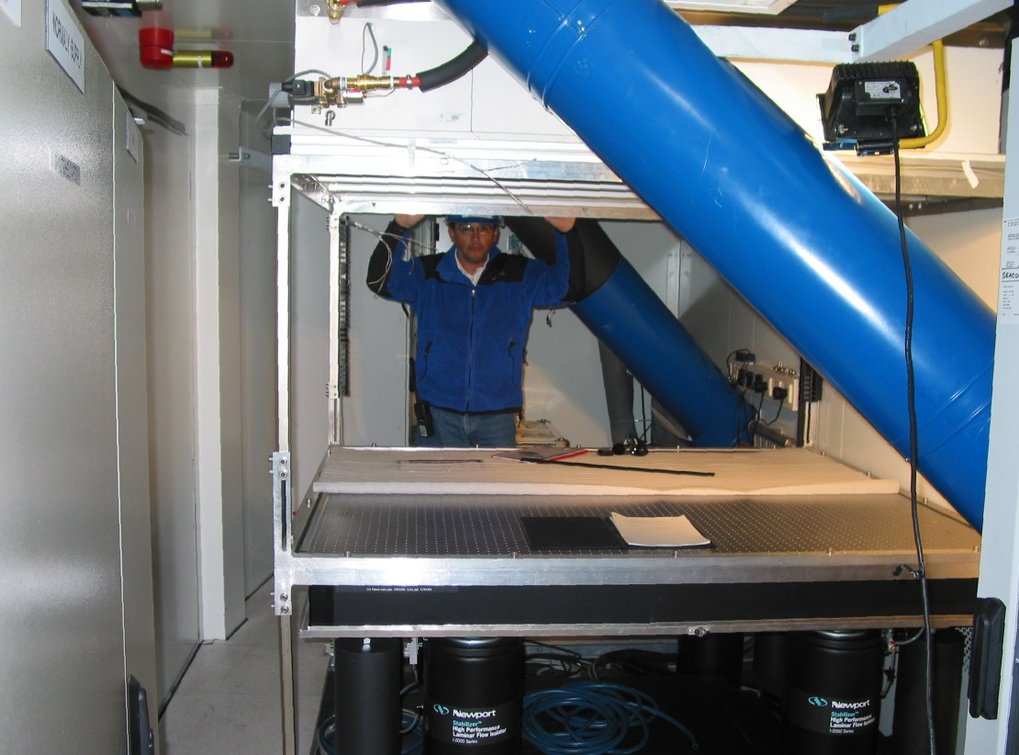
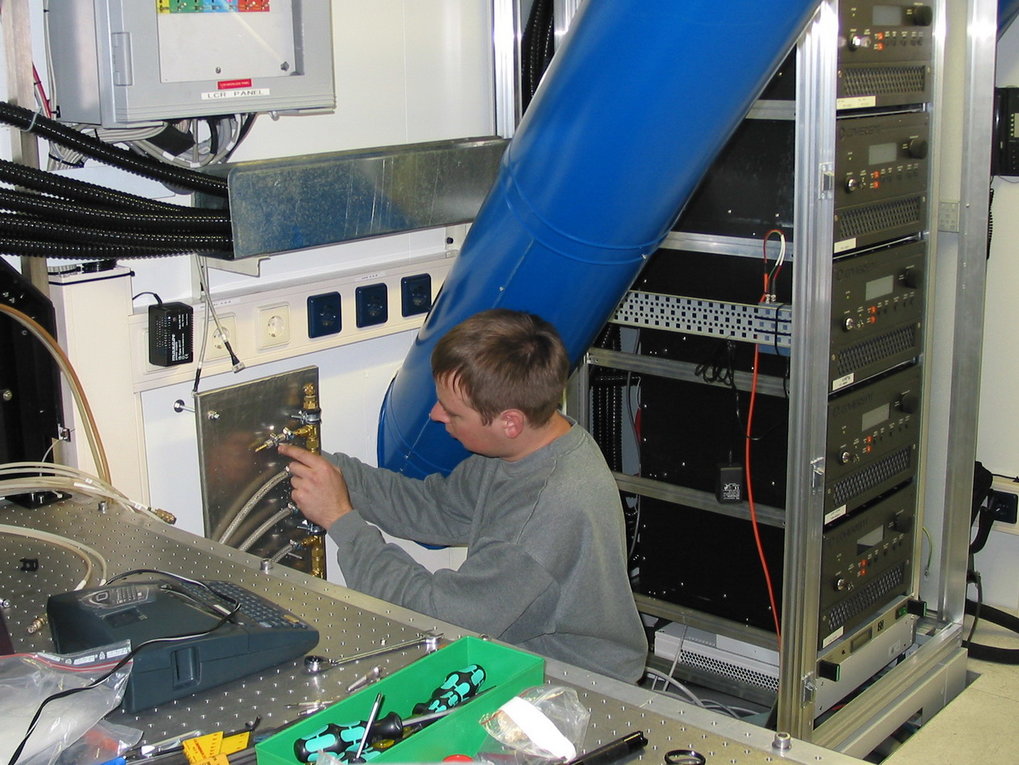
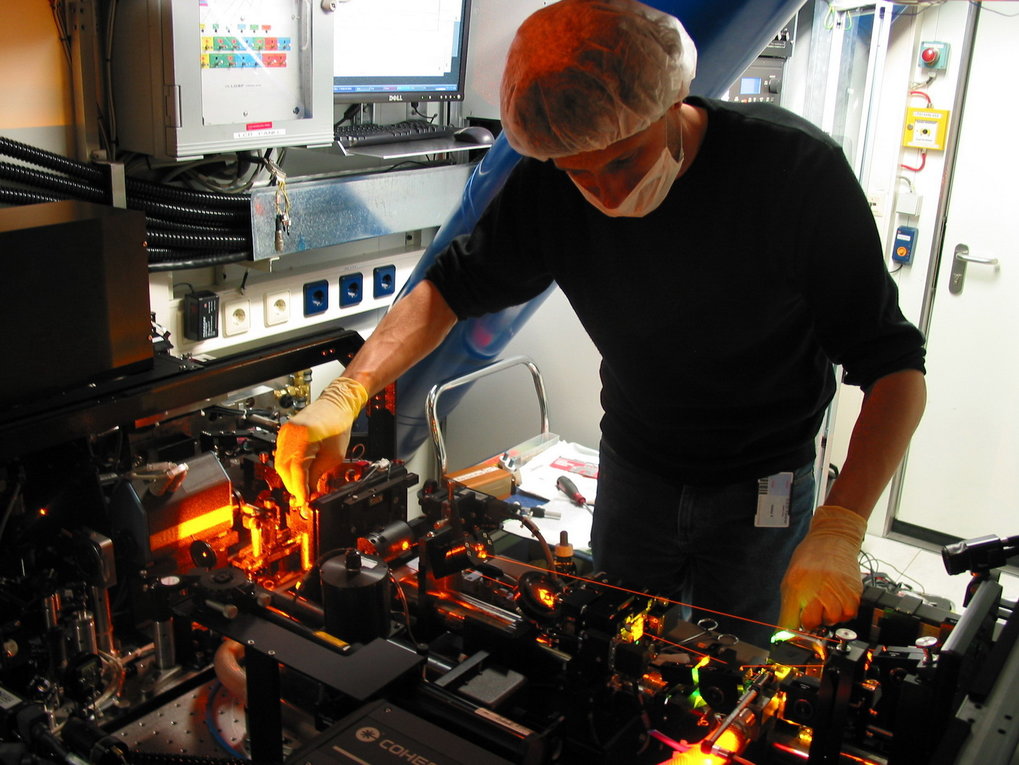
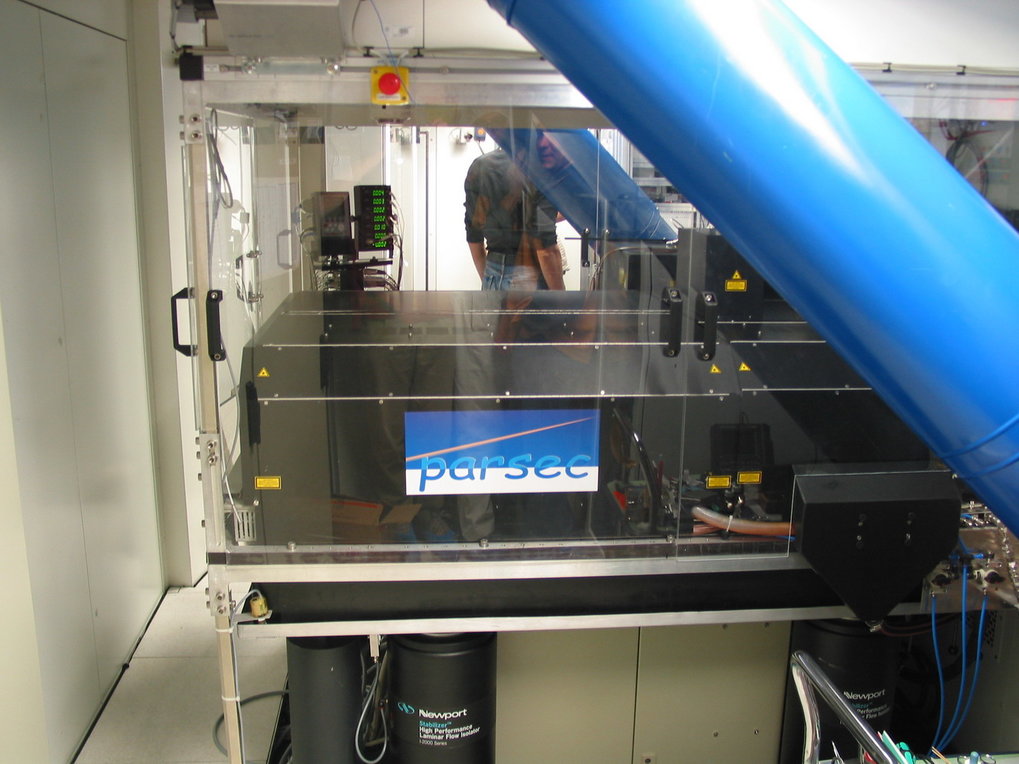
| Jose-Luis, who will maintain and run the laser at the observatory, inside the Laser Clean Room on UT4 at Paranal. The blue tubes are part of the telescope support strucutre and provide something of an obstacle when tuning the laser, since there is not much space around the optical table inside the LCR. |
 |
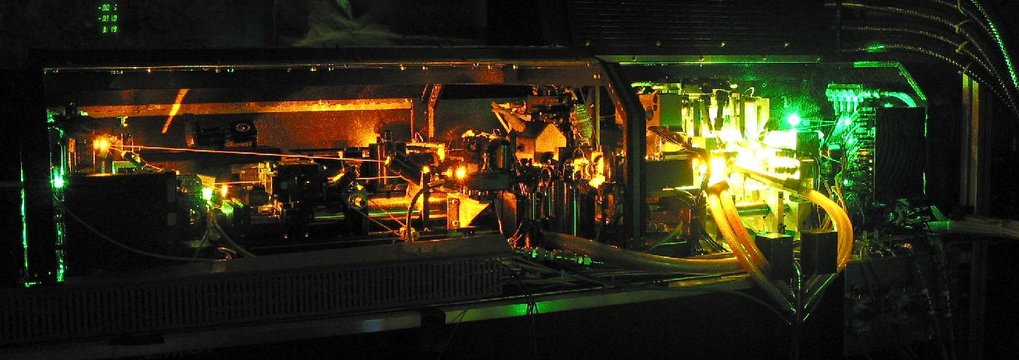
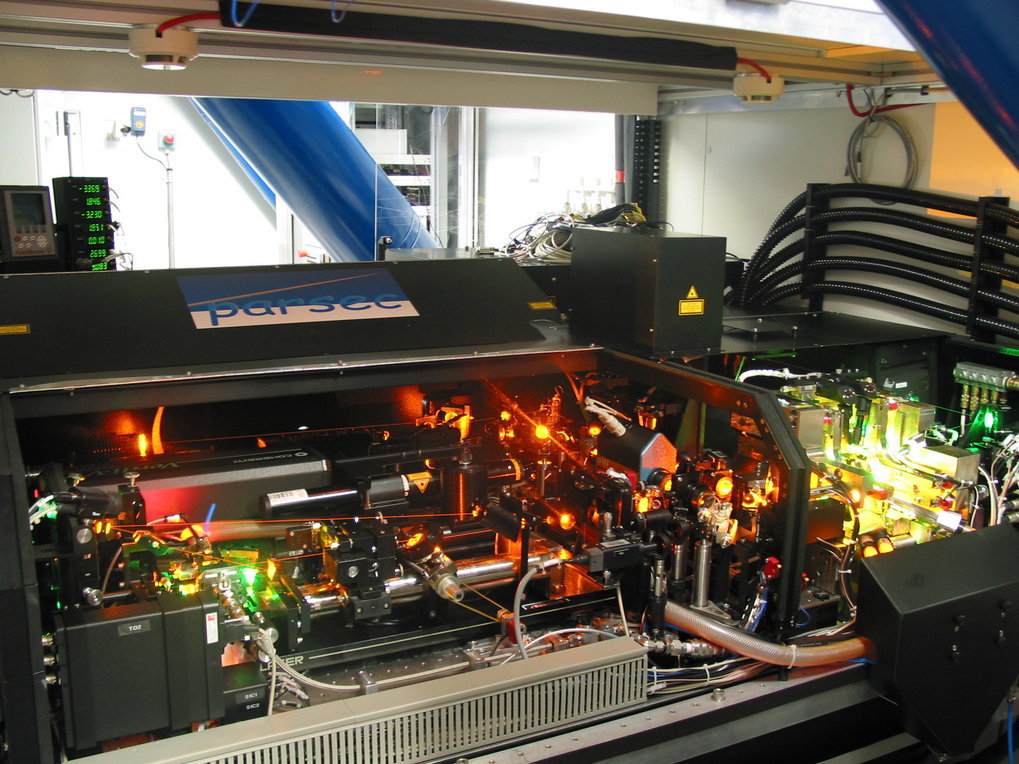
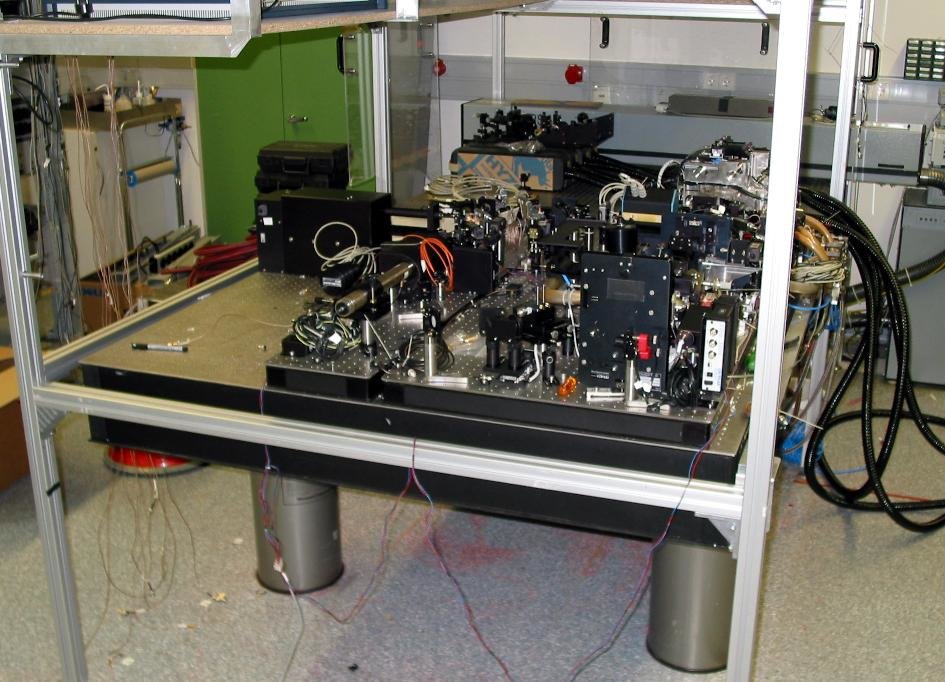
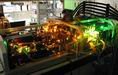
| A view of the PARSEC laser bench before the cover was mounted. The master laser is in the near front corner, and the amplifier to the right. The 5 black tubes are the umbilicals connecting the Verdi laser heads to their power supplies in the electronics rack. The optics board sticking out above the level of the cover is the LIDAR module, which is used ot modulate the laser beam and hence measure the density profile of the sodium layer. |
 |
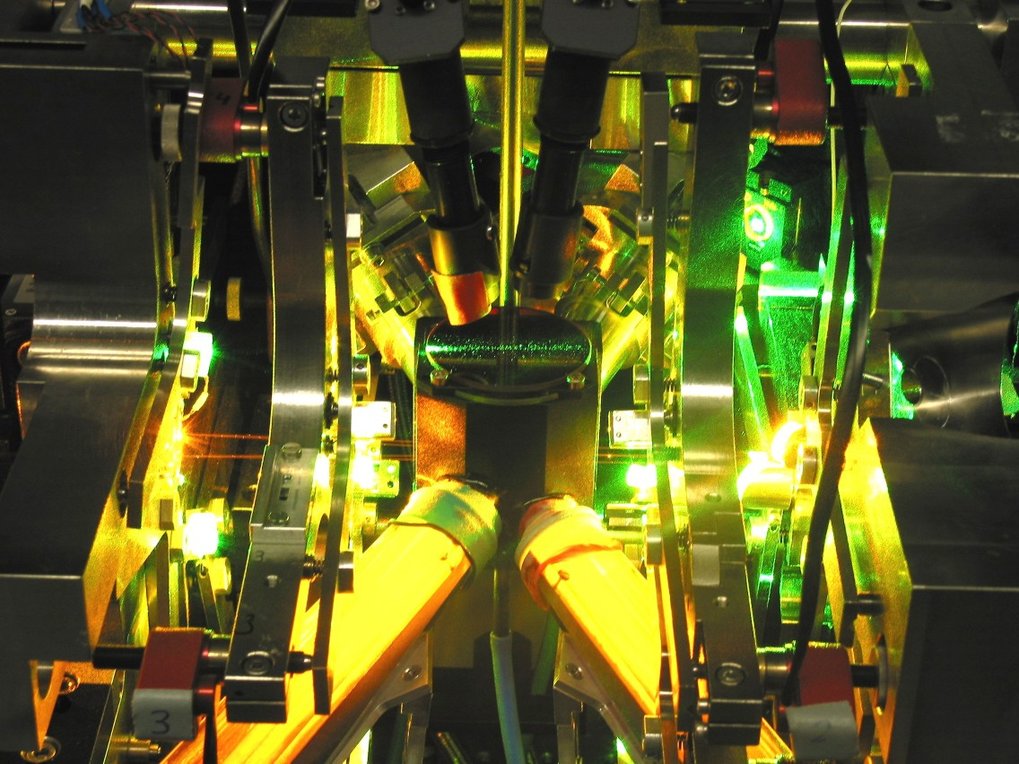
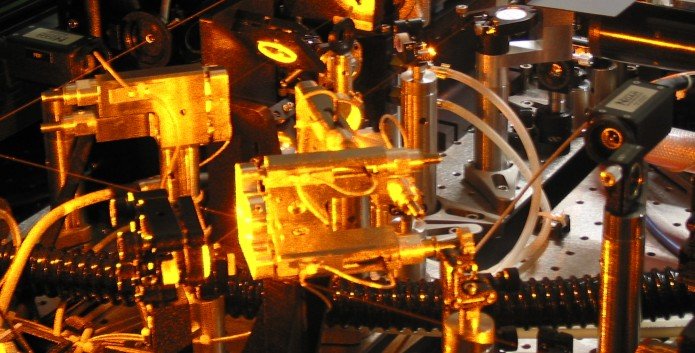
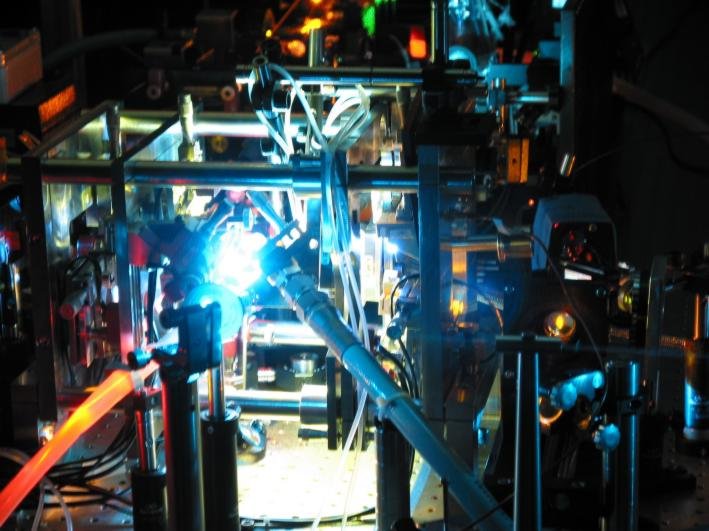
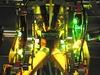
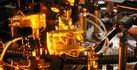
| A close-up view of the amplifier, centered on the enclosed jet chamber while the two dye jets are each being pumped with 2 green 10W Verdi beams. The very solid structure is made almost entirely from invar. The two dye jet nozzles are behind, and the jet-catchers in front are brightly lit with scattered light. The orange 589nm beam can be seen either side of the jet chamber. |
 |
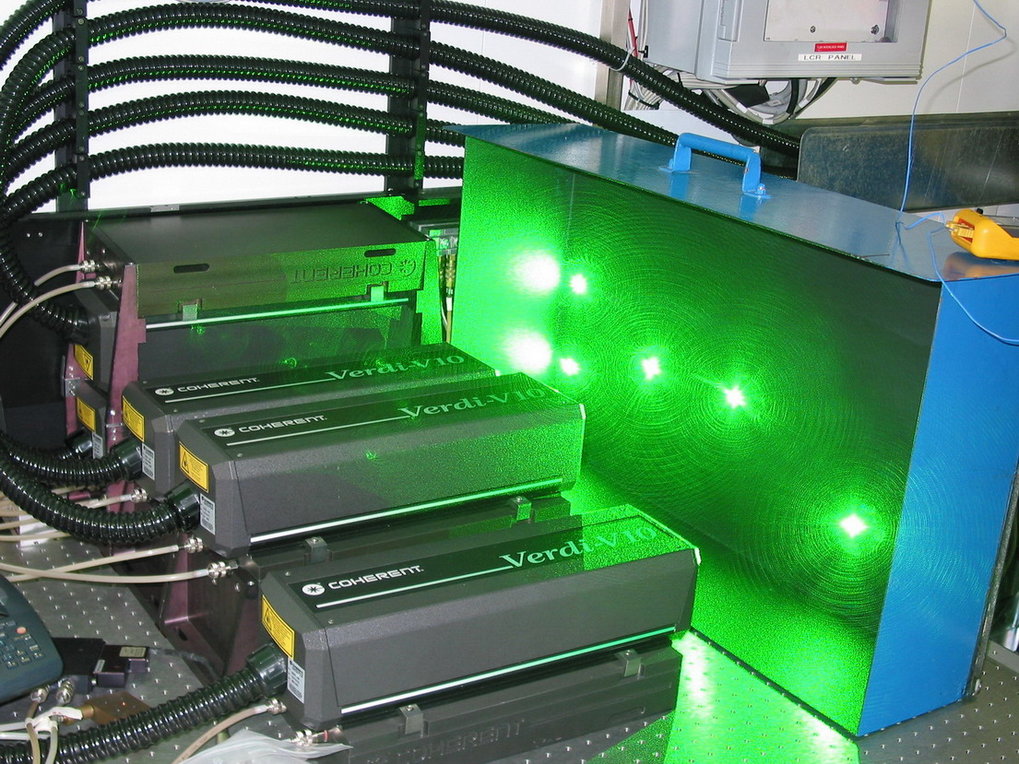
| A Coherent Verdi V10 laser, which can produce a TEM00 10W continuous wave beam. We are using one of these to pump the master laser, and four more for the amplifier. |
 |
| A Coherent 899 ring dye laser which is used as the master oscillator. Modifications include a sapphire dye jet nozzle, motorizing the pointing of the pump beam, the output coupler and the birefringent filter. We are able to automatically both optimise the output power as well as tune the frequency of the laser. |
 |
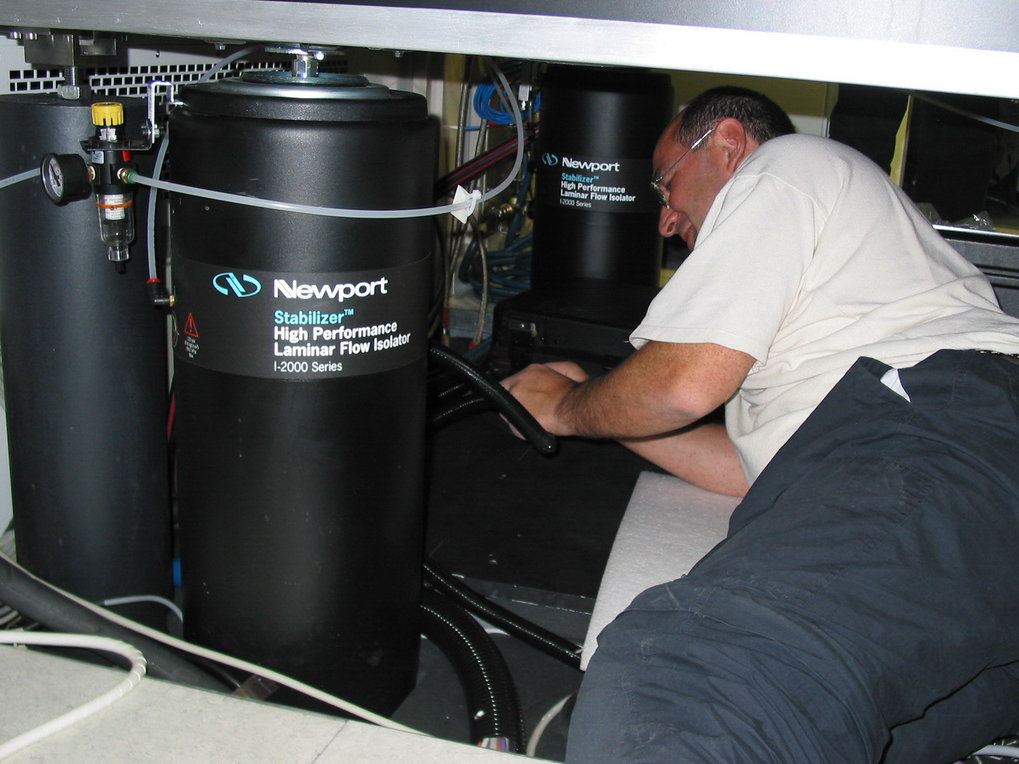
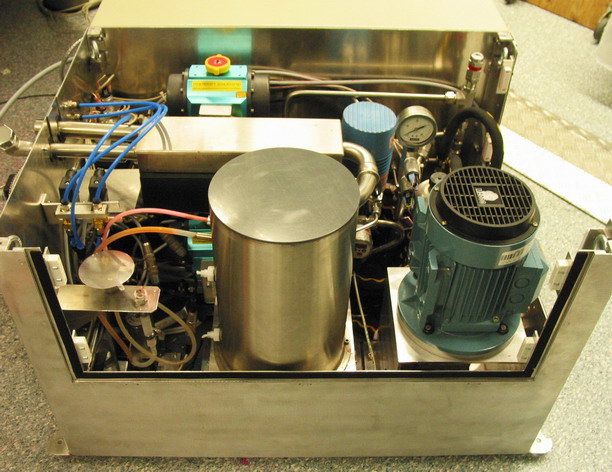
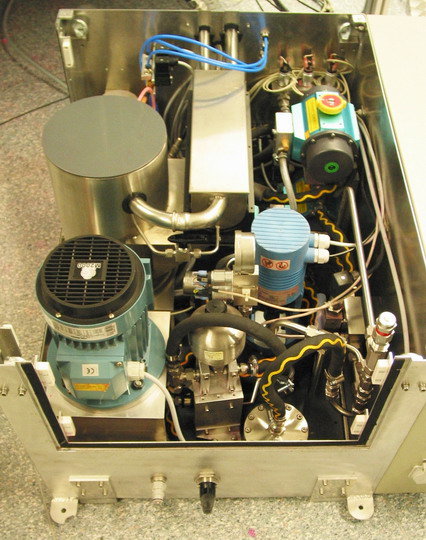
| Views of the dye circulator, which will fit underneath the optical table. A large number of components have been fitted into a very confined space. Access while the circulator is under the table (e.g. to change the dye solution or replace the filters) is through the side panels (removed). |
|
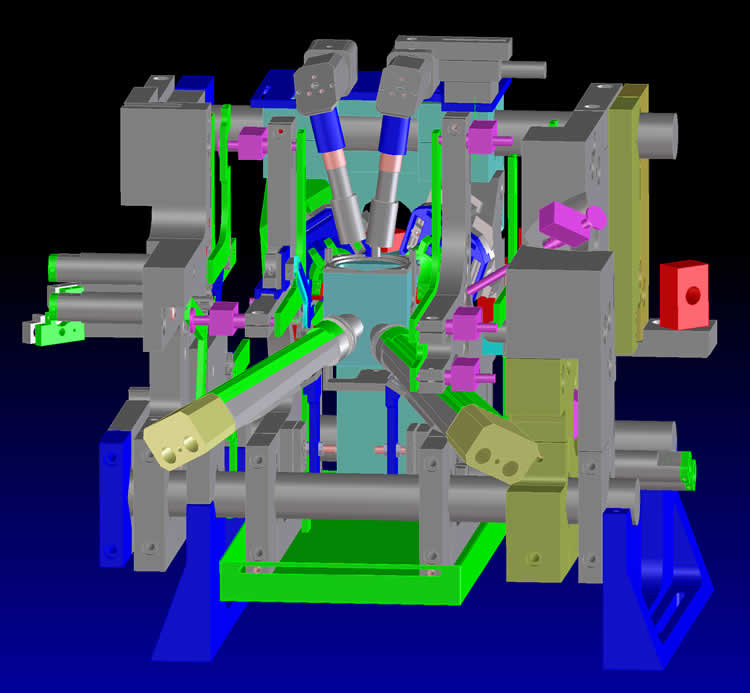
| The 3D design drawing of the amplifier which had a 3-dimensional (rather than planar) cavity. The structure is about 25cm long, built entirely from invar, and contains two dye jets. The beams from two Verdi pump lasers are focussed from opposite sides onto each of two dye jets. |
 |
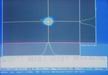
| A scan across the sodium line measuring the doppler-free absorption. The beam in the sodium cell is optically chopped at 10kHz, and a lock-in amplifier is used to measure the signal. This easily separate the two hyperfine transitions, and gives us a FWHM resolution of about 50MHz. |
 |
| An image and cuts showing the spatial profile of the output beam. At the same time as this picutre was taken, the quality of the beam was measured with a Coherent modemaster to be about M2=1.1 (ie virtually diffraction limited). |
 |
| A close-up view of one of the beam positioning tip-tilt stages. We have 5 of these units along the beam path and they are able to keep the beam pointing stable to better than a few microns, helping enormously in the robustness and ease of starting and running the laser. |
 |
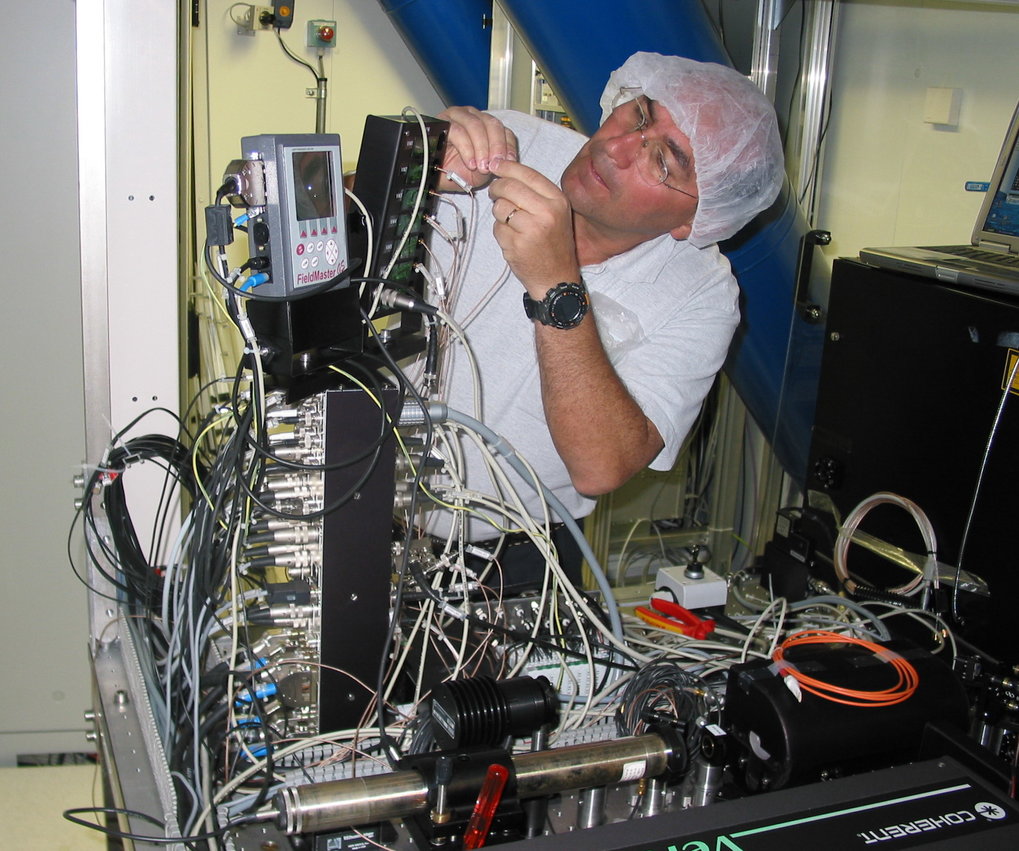
| Stefan Kellner, responsible for the electronics, having finished the tedious task of labelling all the cables and connectors. |
 |
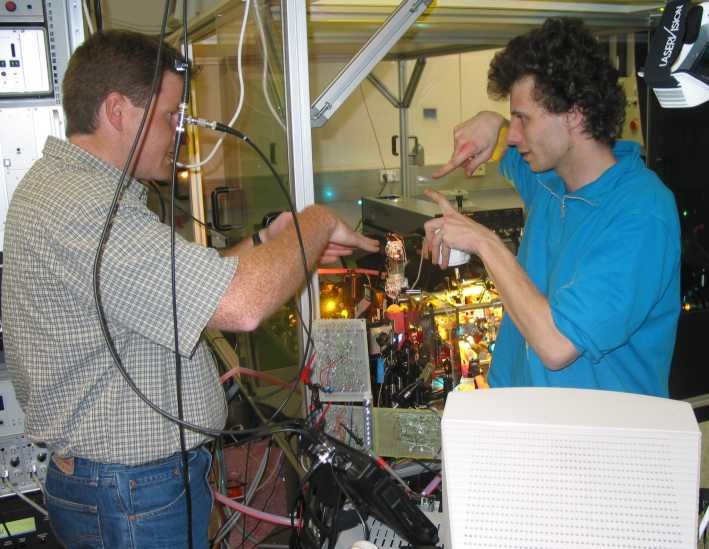
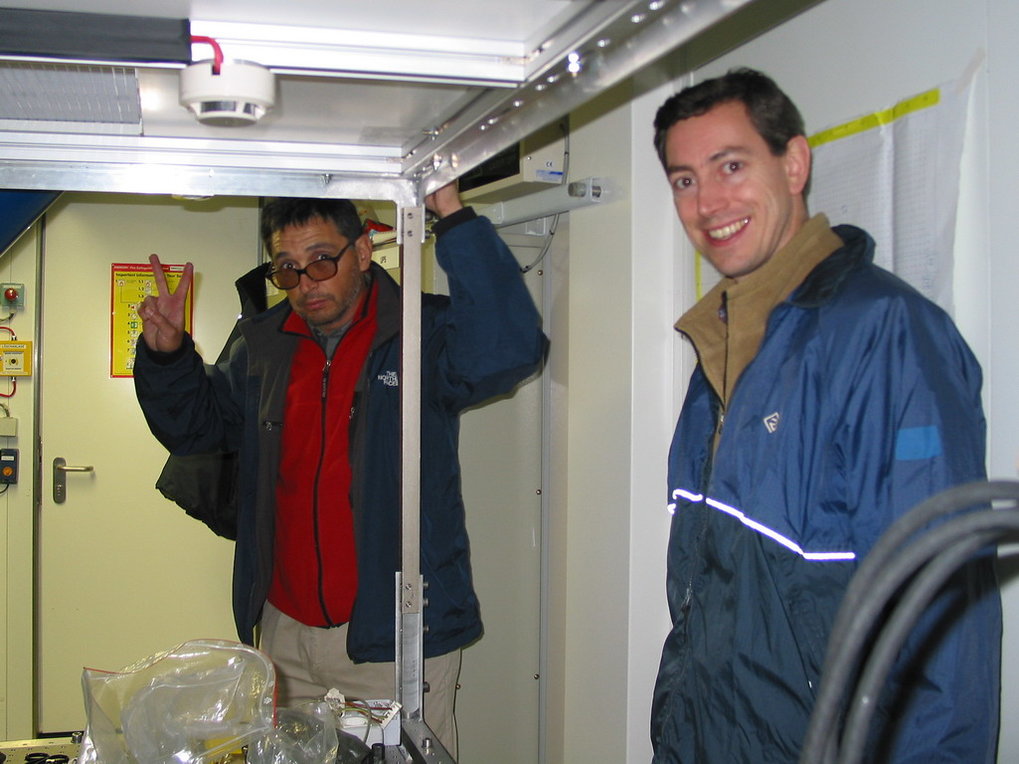
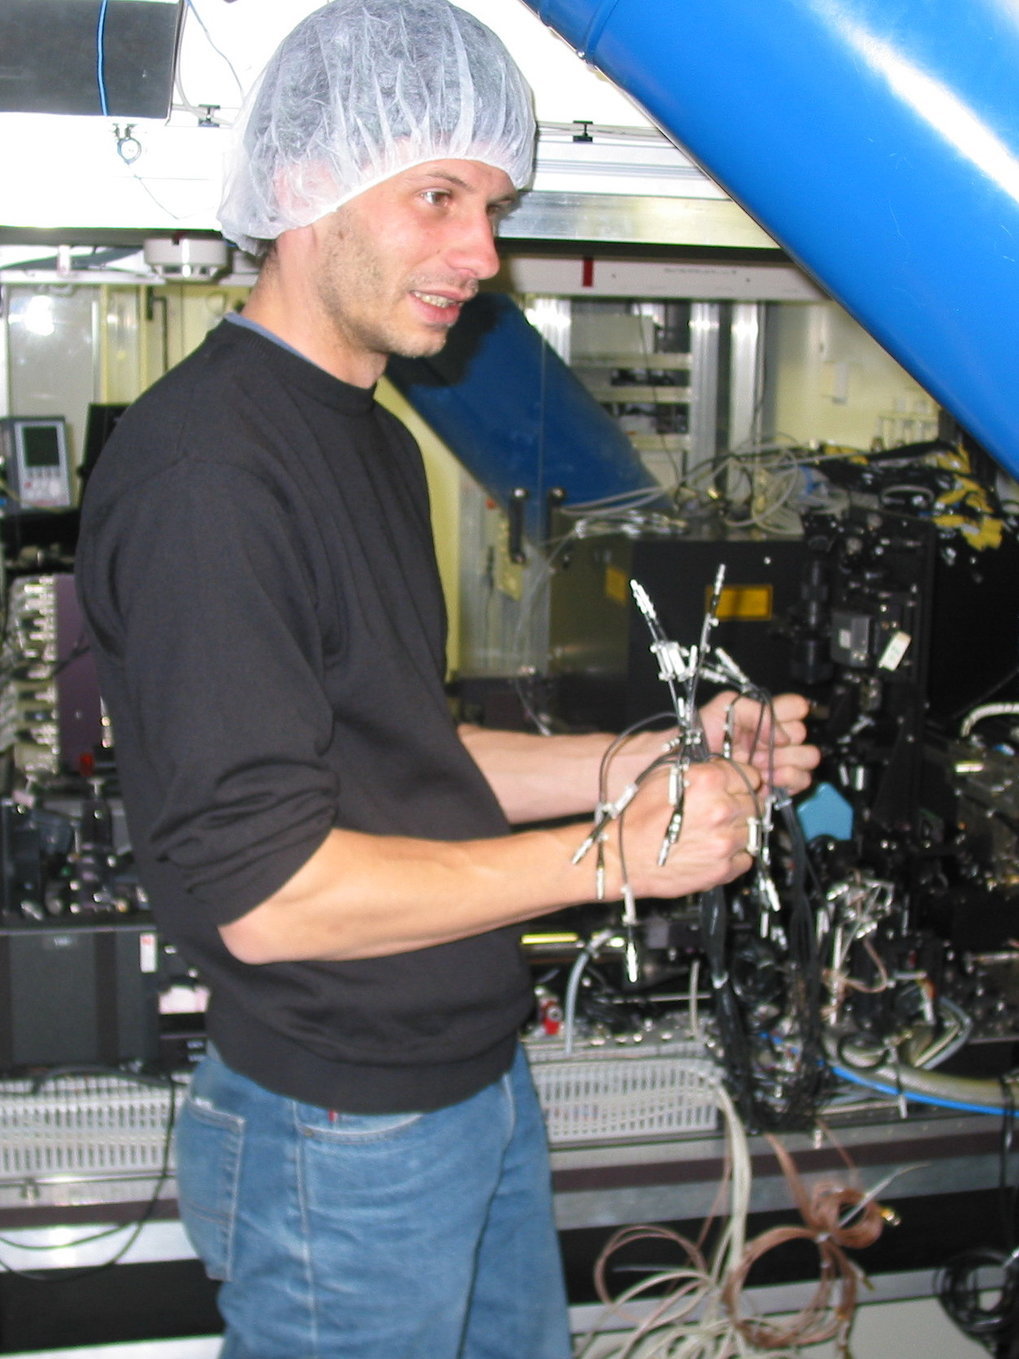
| Wolfgang Hackenberg (from ESO) and Sebastian Rabien discussing the direction of the radiation in the amplifier cavity during the Laser Selection Test. |
 |
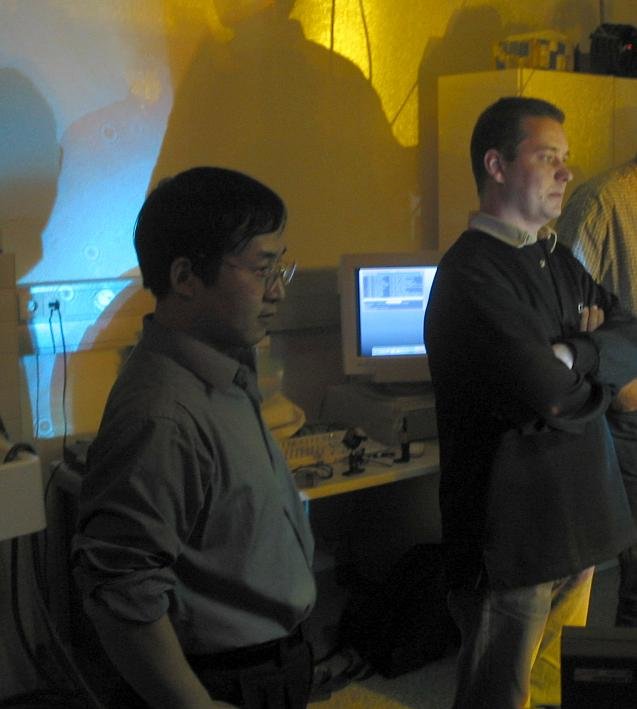
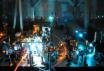
| Jianlang Li and Thomas Ott, lit up by stray laser light, looking on during preparations for the next test. |
 |
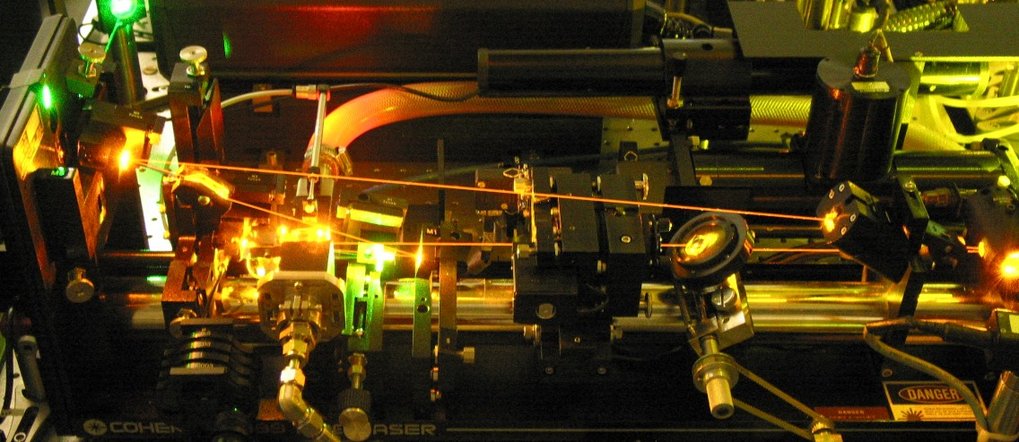
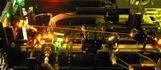
| A view of the master laser (back left) and amplifier (front) during testing of the prototype system. During the development phase we used an Ar+ laser (right) to pump the dye jets in the amplifier. |
 |
| A closer view of the prototype amplifier in operation. With this setup it was possible to reach more than 10W output power, but our efforts were mainly directed towards achieving the stability required. |
 |
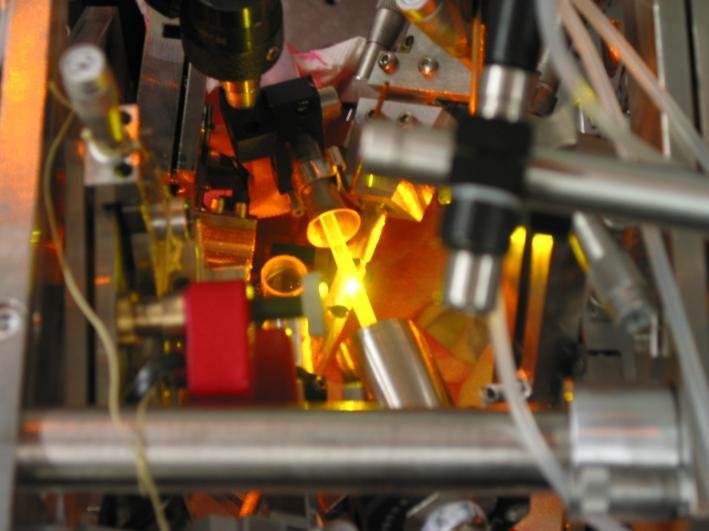
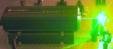
| Testing a new sapphire nozzle. The thin yellow strip is the dye jet, a few millimetres wide and only 200µm thick, at a pressure of 30bar yet with superb optical quality. |
 |
| An Inversion Argon+ laser which was used during the development of PARSEC to pump the amplifier. It can produce up to 70W of power with good beam quality. |
 |
| The spatial profile of the master laser output beam, after only a few minutes tuning. As the vertical and horizontal cuts show, this is already close to single mode. |
 |
| These data show that the spectral profile of the master laser output beam has a FWHM of less than 3MHz (the measurement is limited by the spectrum analyser). |
 |